What Are the New Findings?
As in prior years, mental health disorders, pregnancy-related conditions, and injury/poisoning accounted for the majority (59.8%) of all hospitalizations among active component service members in 2018. However, the hospitalization rate for all causes was the lowest rate in the past 10 years.
What Is the Impact on Readiness and Force Health Protection?
Hospitalizations for mental health disorders, particularly adjustment and mood disorders, reduce operational readiness. Even after discharge from the hospital, unresolved mental health disorders can result in limited and light duty, early attrition, and stress on the service member's unit.
Background
This report documents the frequencies, rates, trends, and distributions of hospitalizations of active component members of the U.S. Army, Navy, Air Force, and Marine Corps during calendar year 2018. Summaries are based on standardized records of hospitalizations at U.S. military and non-military (reimbursed care) medical facilities worldwide. For this report, primary (first-listed) discharge diagnoses are considered indicative of the primary reasons for hospitalizations; summaries are based on the first 3 digits of the International Classification of Diseases, 10th Revision, Clinical Modification (ICD-10-CM) codes used to report primary discharge diagnoses. The analysis depicts the distribution of diagnoses according to the 17 traditional categories of the ICD system. Hospitalizations not routinely documented with standardized, automated records (e.g., during field training exercises or while shipboard) are not centrally available for health surveillance purposes and thus are not included in this report.
Frequencies, Rates, and Trends
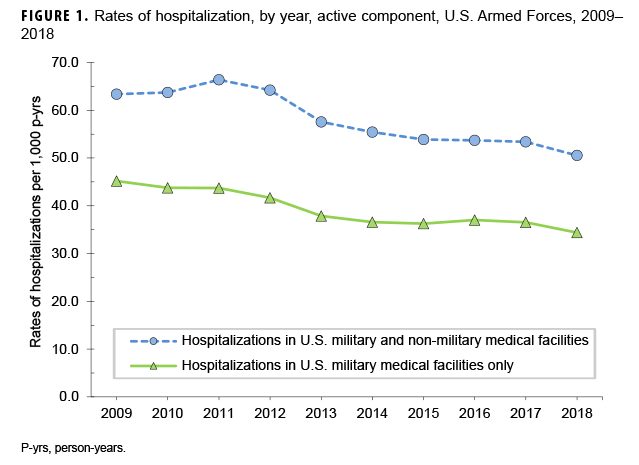
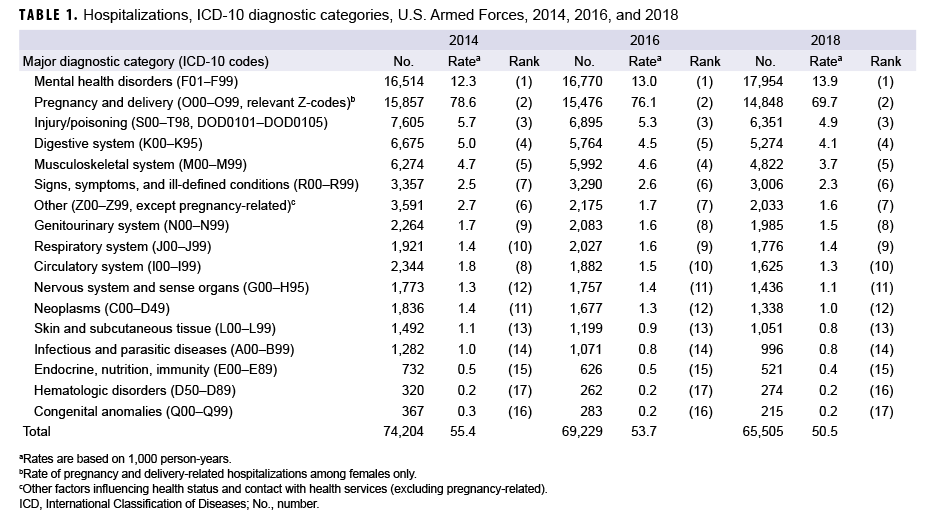
In 2018, there were 65,505 records of hospitalizations of active component members of the U.S. Army, Navy, Air Force, and Marine Corps (Table 1); 32.0% of the hospitalizations were in non-military facilities (data not shown). The annual hospitalization rate (all causes) for 2018 was 50.5 per 1,000 service member person-years (p-yrs) and was the lowest rate reported during 2009–2018, the years covered in this report (Figure 1).
Hospitalizations, by Illness and Injury categories
As in prior years, in 2018, 3 diagnostic categories accounted for nearly three-fifths (59.8%) of all hospitalizations of active component members: mental health disorders (27.4%), pregnancy- and delivery-related conditions (22.7%), and injury/poisoning (9.7%) (Table 1). Similar to 2014 and 2016, in 2018 there were more hospitalizations for mental health disorders than for any other major diagnostic category (per ICD-10); 2008 was the last year in which the number of hospitalizations for pregnancy- and delivery-related conditions exceeded the number for mental health disorders (data not shown).
Comparing 2018 to 2014, numbers of hospitalizations decreased in all major categories of illnesses and injuries except for mental health disorders, which increased 8.7% (Table 1). The largest drop in the number of hospitalizations during 2014–2018 was seen in the category of "other factors influencing health status and contact with health services" (excluding pregnancy-related) (hospitalization difference, 2014–2018: -1,558; 43.4% decrease).
Hospitalizations, by Sex
In 2018, the hospitalization rate (all causes) among females was more than 3 times that of males (121.1 per 1,000 p-yrs vs. 36.6 per 1,000 p-yrs, respectively). Excluding pregnancy and delivery, the rate of hospitalizations among females (51.4 per 1,000 p-yrs) was 40.3% higher than among males (36.6 per 1,000 p-yrs) (data not shown).
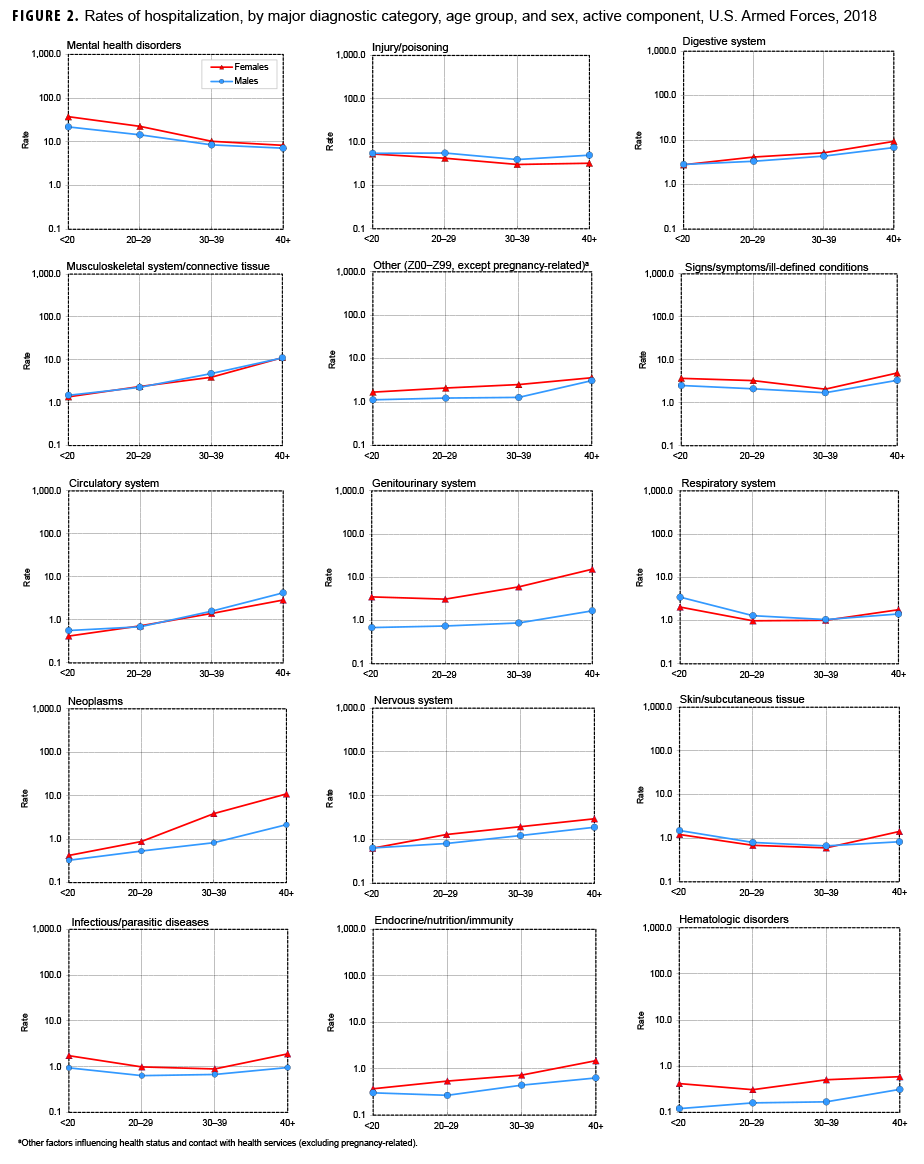
Overall hospitalization rates were higher (i.e., the rate difference [RD] was greater than 1.0 per 1,000 p-yrs) among females than males for mental health disorders (female:male RD: 7.0 per 1,000 p-yrs); genitourinary disorders (RD: 4.0 per 1,000 p-yrs); neoplasms (RD: 1.7 per 1,000 p-yrs); and, signs, symptoms, and ill-defined conditions (RD: 1.0 per 1,000 p-yrs) (data not shown). Hospitalization rates were higher among males than females for injury/poisoning (male:female RD: 1.1 per 1,000 p-yrs). Hospitalization rates were relatively similar among males and females for the remaining 11 major disease-specific categories (data not shown).
Relationships between age and hospitalization rates varied considerably across illness- and injury-specific categories. For example, among both males and females, hospitalization rates generally increased with age for neoplasms, circulatory, genitourinary, digestive, nervous, endocrine/nutrition/immunity, and musculoskeletal system/connective tissue disorders (Figure 2). Among service members aged 30 years or older, there was a pronounced difference by sex in the slopes of the rates of neoplasms, with the rates among females notably higher than among males in the same age groups. Rates decreased with age for mental health disorders but were relatively stable across age groups for injury/poisoning, skin and subcutaneous tissue, and infectious/parasitic diseases.
Most Frequent Diagnoses
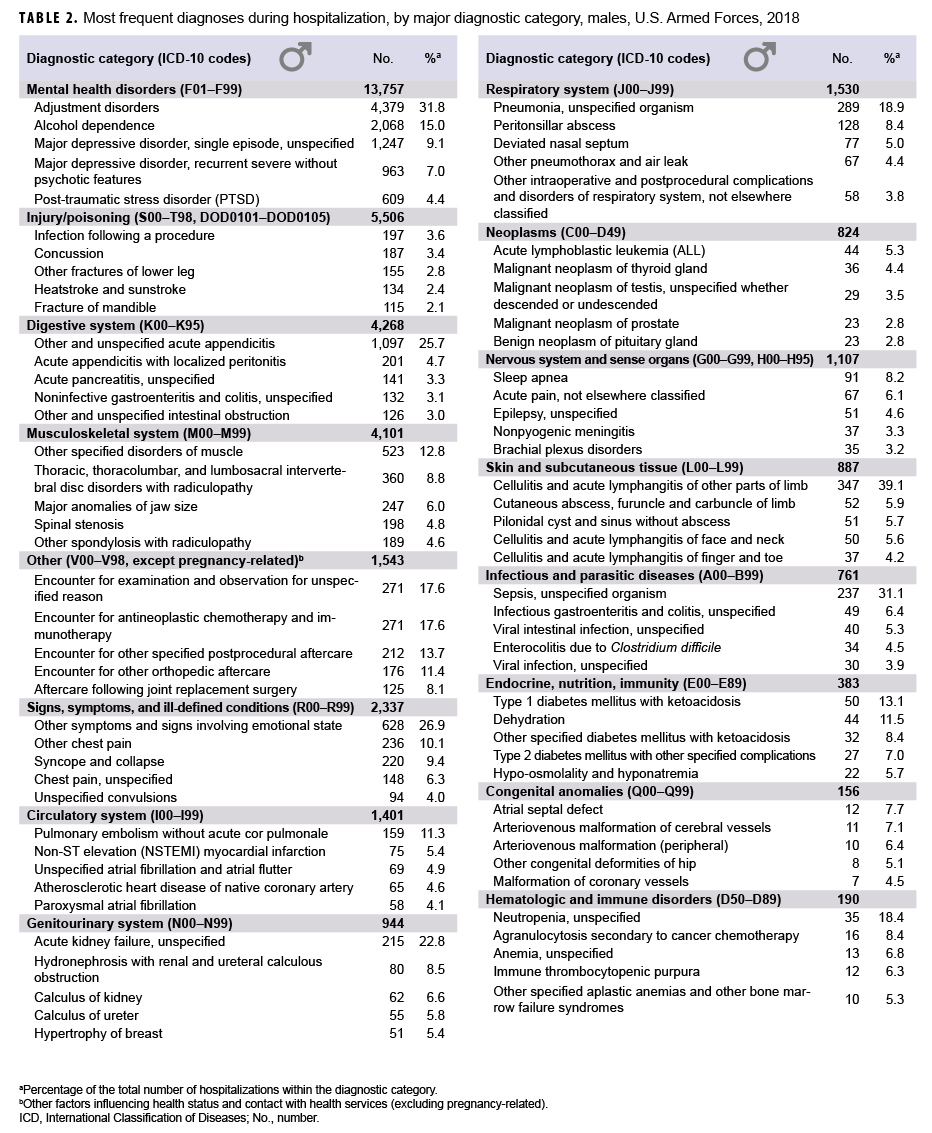
In 2018, adjustment disorder was the most frequent discharge diagnosis among males (n=4,379) (Table 2). Alcohol dependence (n=2,068), major depressive disorder (single episode, unspecified) (n=1,247), acute appendicitis (n=1,097), major depressive disorder [recurrent, severe without psychotic features] (n=963), other symptoms and signs involving emotional state (n=628), and post-traumatic stress disorder (PTSD) (n=609) were the next 6 most frequent diagnoses in males (Table 2).
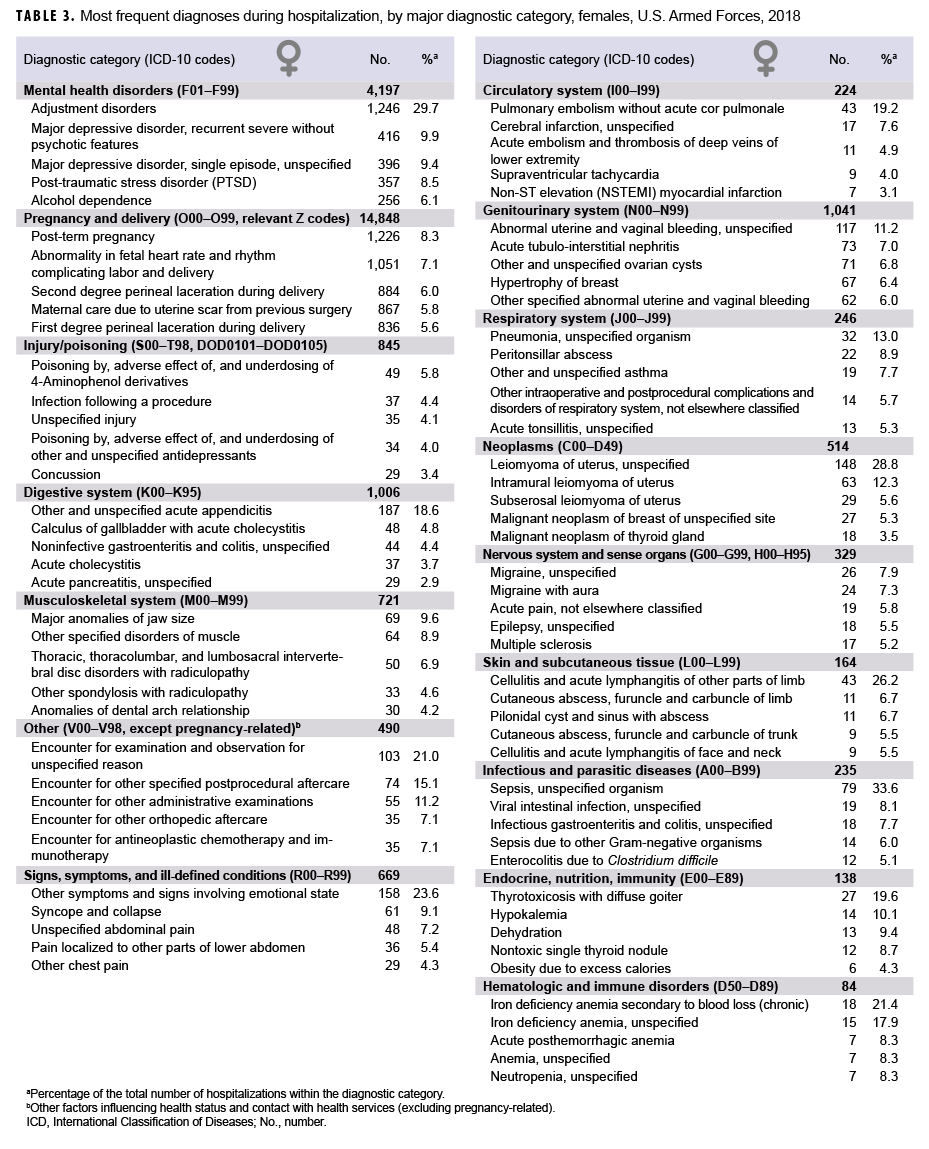
In 2018, pregnancy- and delivery-related conditions represented 4 of the top 5 leading causes of hospitalizations among females, and this category alone accounted for 57.5% of all hospitalizations of females (Table 3). The top 4 discharge diagnoses in this condition category included post-term (late) pregnancy (n=1,226), abnormality in fetal heart rate and rhythm (n=1,051), second-degree perineal laceration during delivery (n=884), and maternal care due to uterine scar from previous surgery (n=867). Other than pregnancy- and delivery-related diagnoses, leading causes of hospitalizations among females were adjustment disorder (n=1,246), recurrent major depressive disorder without psychotic features (n=416), major depressive disorder [single episode, unspecified] (n=396), PTSD (n=357), and alcohol dependence (n=256). Combined, mental health disorder diagnoses accounted for one-sixth (16.3%) of all hospitalizations of females.
Injury/Poisoning
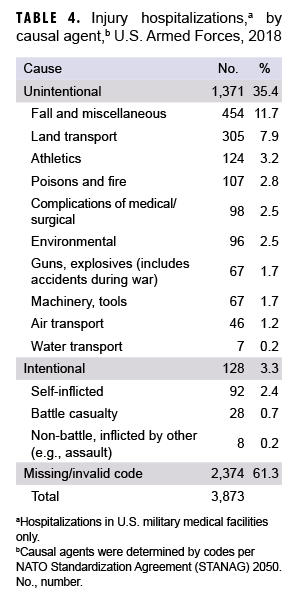
As in the past, in 2018, injury/poisoning was the third leading cause of hospitalizations of U.S. military members (Table 1). Of all injury/poisoning-related hospitalizations in U.S. military medical facilities (n=3,873), more than three-fifths (61.3%) had a missing or invalid NATO Standardization Agreement (STANAG) code (Table 4). Nearly one-third (33.1%) of all "unintentional" injury/poisoning-related hospitalizations in U.S. military facilities (n=1,371) were considered caused by falls and miscellaneous (n=454), while land transport (n=305) accounted for 22.2% of "unintentional" injury/poisoning-related hospitalizations (Table 4).
Among males, injury/poisoning-related hospitalizations were most often related to infection following a procedure, concussion, or other fractures of the lower leg (Table 2). Among females, injury/poisoning-related hospitalizations were most often related to poisoning by/adverse effect of acetaminophen derivatives, infection following a procedure, unspecified injuries, or poisoning by/adverse effect of/underdosing of other and unspecified antidepressants (Table 3).
Durations of Hospitalizations
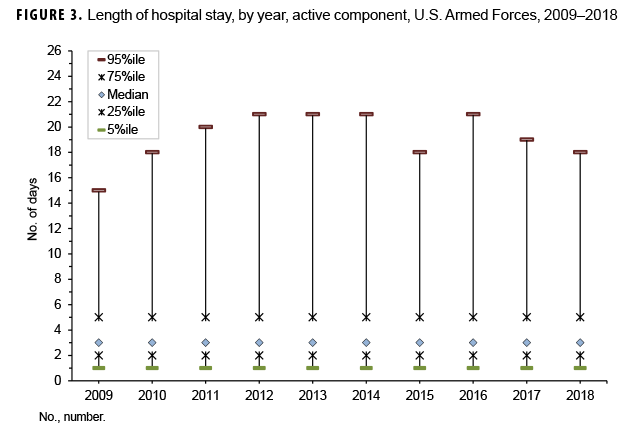
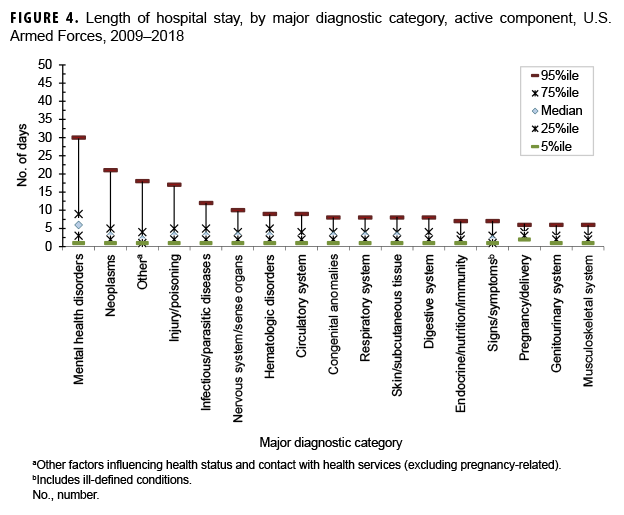
During 2009–2018, the median duration of hospital stays (all causes) remained stable at 3 days (Figure 3). As in previous years, medians and ranges of durations of hospitalizations varied considerably across major diagnostic categories. For example, median lengths of hospitalizations varied from 2 days (e.g., musculoskeletal system disorders; genitourinary system disorders; signs, symptoms, and ill-defined conditions) to 6 days (mental health disorders). For most diagnostic categories, less than 5% of hospitalizations exceeded 12 days, but for 4 categories, 5% of hospitalizations had longer durations: injury/poisoning (17 days), other non-pregnancy-related factors influencing health status and contact with health services (primarily orthopedic aftercare and rehabilitation following a previous illness or injury) (18 days), neoplasms (21 days), and mental health disorders (30 days) (Figure 4).
Hospitalizations, by Service
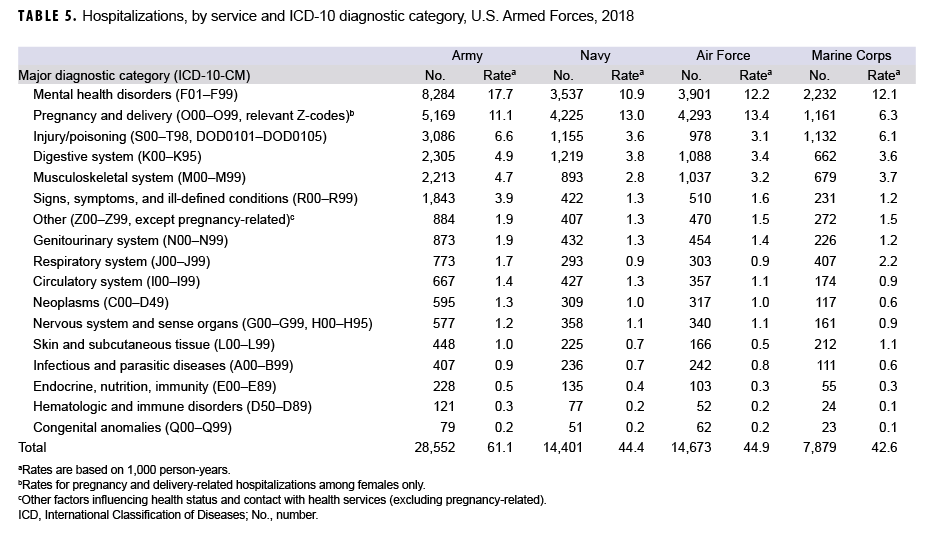
Among active component members of the Navy and Air Force, pregnancy- and delivery-related conditions accounted for more hospitalizations than any other category of illnesses or injuries; however, among active component members of the Army and Marine Corps, mental health disorders were the leading cause of hospitalizations (Table 5). The crude hospitalization rate for mental health disorders among active component Army members (17.7 per 1,000 p-yrs) was higher than among members of all other services.
Injury/poisoning was the third leading cause of hospitalizations in the Army and the Marine Corps, fourth in the Navy, and fifth in the Air Force (Table 5). The hospitalization rate for injury/poisoning was slightly higher among soldiers (6.6 per 1,000 p-yrs) than Marines (6.1 per 1,000 p-yrs).
Editorial Comment
In 2018, the hospitalization rate for all causes among active component members was the lowest rate seen in the past 10 years. As in past years, in 2018, mental health disorders, pregnancy- and delivery-related conditions, and injury/poisoning accounted for more than half of all hospitalizations of active component members. Adjustment and mood disorders were among the leading causes of hospitalizations among both male and female service members. In recent years, attention at the highest levels of the U.S. military and significant resources have focused on detecting, diagnosing, and treating mental health disorders—especially those related to long and repeated deployments and combat stress. Annual numbers and crude rates of hospitalizations for mental health disorders increased between 2014 and 2018; the number of mental health disorder-related hospitalizations in 2018 was more than a thousand greater than in 2016 and the crude rate was 6.4% higher.
The reasons for the recent downturn in the trends for annual numbers of hospitalizations overall and for the slight increase in mental health disorder-related hospitalizations in particular are not clear. It is conceivable that there has been a decline in the impact of combat and peacekeeping operations on overall morbidity among service members since the withdrawal of U.S. forces from Iraq and the official end to combat operations in Afghanistan. Continued monitoring of hospitalizations and all other health care encounters over time may permit elucidation of the possible reasons for the recent trends in hospitalization.
This summary has certain limitations that should be considered when interpreting the results. For example, the scope of this report is limited to members of the active components of the U.S. Armed Forces. Many reserve component members were hospitalized for illnesses and injuries while serving on active duty in 2018; however, these hospitalizations are not accounted for in this report. In addition, many injury/poisoning-related hospitalizations occur in non-military hospitals. If there are significant differences between the causes of injuries and poisonings that resulted in hospitalizations in U.S. military and non-military hospitals, the summary of external causes of injuries requiring hospital treatment reported here (Table 4) could be misleading. Also, this summary is based on primary (first-listed) discharge diagnoses only; however, in many hospitalized cases, there are multiple underlying conditions. For example, military members who are wounded in combat or injured in motor vehicle accidents may have multiple injuries and complex medical and psychological complications. In such cases, only the first-listed discharge diagnosis would be accounted for in this report. Finally, the new electronic health record for the Military Health System, MHS GENESIS, was implemented at several military treatment facilities during 2017. Medical data from sites using MHS GENESIS are not available in the Defense Medical Surveillance System. These sites include Naval Hospital Oak Harbor, Naval Hospital Bremerton, Air Force Medical Services Fairchild, and Madigan Army Medical Center. Therefore, medical encounter data for individuals who were hospitalized at any of these facilities during 2018 were not included in this analysis. Even with these limitations, this report provides useful and informative insights regarding the natures, rates, and distributions of the most serious illnesses and injuries that affect active component military members.