Skip main navigation

Military Health System

Clear Your Browser Cache

This website has recently undergone changes. Users finding unexpected concerns may care to clear their browser's cache to ensure a seamless experience.

Surveillance Snapshot: Trends in Opioid Prescription Fills Among U.S. Military Service Members During Fiscal Years 2007–2017

Image of U.S. Air Force Tech Sgt. Ryan Marr, 18th Medical Group pharmacy craftsman, processes prescriptions, June 8, 2018, at Kadena Air Base, Japan. The pharmacy processes and fills prescriptions for hundreds of different medical needs. (U.S. Air Force photo by Staff Sergeant Jessica H. Smith) Merriam/Released). U.S. Air Force Tech Sgt. Ryan Marr, 18th Medical Group pharmacy craftsman, processes prescriptions, June 8, 2018, at Kadena Air Base, Japan. The pharmacy processes and fills prescriptions for hundreds of different medical needs. (U.S. Air Force photo by Staff Sergeant Jessica H. Smith) Merriam/Released)

This snapshot highlights unadjusted metrics of opioid prescription fills among active duty and retired service members using data from the Pharmacy Data Transaction Service of the Military Health System (MHS). The metrics described include

  • the percentage of active component, reserve component, and military retirees who filled at least 1 opioid prescription (therapeutic class = opiate agonist) in a given year (Figure 1, Table);
  • the median number of fills per year among those with at least 1 fill (Table); and
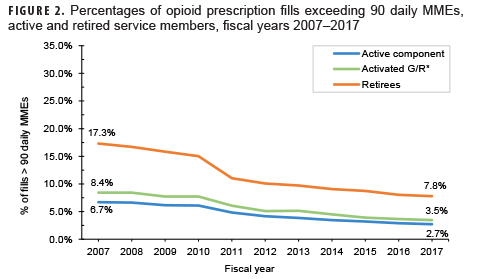
  • the percentage of opioid fills that exceeded 90 daily morphine milligram equivalents (MMEs) (Figure 2).a

Despite decreasing fill rates in recent years, nearly 1 in 4 active duty and retired service members had a filled opioid prescription in 2017 (Figure 1). Active duty and activated Guard/Reserve members who received an opioid prescription had a median of 2 fills per patient in 2017, while retirees had a median of 7 fills per patient (Table). Moreover, a higher percentage of retirees' opioid prescriptions were for high-dose prescriptions (as determined by MMEs)1,2 compared to active duty and activated Guard/Reserve, although rates were not adjusted for age (Figure 2). While increased duration and prescriptions greater than 90 MME per day are not necessarily problematic in and of themselves, both are risk factors for potential misuse and may be indicators of potentially concerning prescribing practices.3 These findings highlight the importance of tracking opioid fills in the MHS, monitoring patients with opioid prescriptions, expanding surveillance efforts to assess prescription practices, and limiting opportunities for opioid misuse and abuse. Despite substantial rates of opioid prescription fills, opioid use disorders are diagnosed infrequently among service members in the MHS (0.2% prevalence from 2010–2015).4 It is important to emphasize and sustain initiatives such as the Defense Health Agency's Opioid Prescriber Safety Training Program as well as regulatory guidance5 aimed at facilitating the responsible use of this important facet of pain management.

aDaily MME = (strength per unit) x (number of units/days' supply) x (MME conversion factor).1,2,5

Author affiliations: Psychological Health Center of Excellence, J-9 Research and Development Directorate of the Defense Health Agency (Mr. Peters, Dr. Kincaid, Ms. Quah, Ms. Greenberg, Dr. Curry); Salient CRGT, Inc. (Mr. Peters, Dr. Kincaid, Ms. Quah, Ms. Greenberg)

References

  1. Centers for Disease Control and Prevention. Opioid oral morphine milligram equivalent (MME) conversion factors. https://www.cms.gov/Medicare/Prescription-Drug-Coverage/PrescriptionDrugCovContra/Downloads/Opioid-Morphine-EQ-Conversion-Factors-Aug-2017.pdf. Accessed 24 June 2019.
  2. Centers for Disease Control and Prevention. Calculating total daily dose of opioids for safer dosage. https://www.cdc.gov/drugoverdose/pdf/calculating_total_daily_dose-a.pdf. Accessed 24 June 2019.
  3. Centers for Disease Control and Prevention. Vital signs: opioid prescribing. https://www.cdc.gov/vitalsigns/pdf/2017-07-vitalsigns.pdf. Published July 2017. Accessed 24 June 2019.
  4. Office of the Secretary of Defense. Report to Congress on prescription drug abuse. https://health.mil/Reference-Center/Reports/2016/04/15/Prescription-Drug-Abuse. Published March 2016. Accessed 24 June 2019
  5. Defense Health Agency. Procedural Instruction 6025.04. Pain Management and Opioid Safety in the MHS. 8 June 2018.
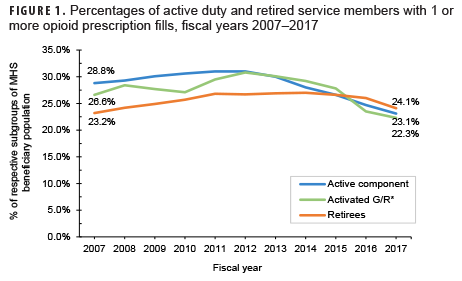
Percentages of active duty and retired service members with 1 or more opioid prescription fills, fiscal years 2007–2017

Percentages of opioid prescription fills exceeding 90 daily MMEs, active and retired service members, fiscal years 2007–2017

Summary of percentages of beneficiaries with 1 or more opioid prescriptions, of median numbers of prescription fills per patient per year, and of percentages of opioid prescription fills that exceeded 90 daily MMEs, fiscal years 2007–2017

You also may be interested in...

Article
Jun 1, 2023

Absolute and Relative Morbidity Burdens Attributable to Various Illnesses and Injuries Among Active Component Members, U.S. Armed Forces, 2022

This annual summary uses several health care burden measures to quantify the impacts of various illnesses and injuries in 2022 among members of the active component of the U.S. Armed Forces. Health care burden metrics include the total number of medical encounters, individuals affected, and hospital bed days.

Article
Jun 1, 2023

Absolute and Relative Morbidity Burdens Attributable to Various Illnesses and Injuries Among Active Component Members, U.S. Coast Guard, 2022

This report employs the same disease classification system and health care burden measures as employed in the MSMR burden analysis of the U.S. Armed Forces active component to quantify the impacts of various illnesses and injuries among members of the active component of the U.S. Coast Guard in 2022.

Report
May 1, 2023

MSMR Vol. 30 No. 5 - May 2023

.PDF | 1023.59 KB

The May 2023 MSMR reintroduces a monthly reportable medical event (RME) summary for the active component and MHS beneficiaries; then features a review of enhanced mpox outbreak case detection among MHS beneficiaries through ESSENCE (Electronic Surveillance System for the Early Notification of Community-based Epidemics); followed by a report on ...

Article
May 1, 2023

Enhanced Mpox Outbreak Case Detection Among MHS Beneficiaries Through Use of ESSENCE (Electronic Surveillance System for the Early Notification of Community-based Epidemics)

A colorized scanning electron microscopic image of the mpox virus on the surface of infected VERO E6 cells

This report describes how ESSENCE, which collects near real-time biosurveillance data globally on U.S. military personnel, monitored the mpox outbreak in 2002 and assesses its detection of confirmed/probable cases among MHS beneficiaries. ESSENCE systematically queries millions of health encounters to detect records of potential public health ...

Article
May 1, 2023

Portable RT-PCR and MinION Nanopore Sequencing as a Proof-of-Concept SARS-CoV-2 Biosurveillance in Wastewater

Wastewater treatment facility

This study reports on the efficacy of 2 different portable nucleic acid detection technologies, RT-PCR and MinION Mk1C nanopore sequencing, which identified SARS-CoV-2 variants in wastewater collected at Tyndall AFB during a 2-month surveillance. This highly multiplexed approach circumvented signal dropout associated with the detection of newly ...

Article
May 1, 2023

Increasing Incidence Rates of Eosinophilic Esophagitis in Active Component Service Members, U.S. Armed Forces, 2009–2021

A respiratory therapist visualizes the vocal chords of a patient using an endoscopy tool

This study examines the incidence of eosinophilic esophagitis among the active component of the U.S. Armed Forces from 2009 to 2021. Reported prevalence has been increasing worldwide, with a recent meta-analysis estimating 34.2 cases per 100,000 persons.

Article
Apr 1, 2023

Update: Heat Exhaustion and Heat Stroke Among Active Component Members of the U.S. Armed Forces, 2018–2022

Immediate recognition and response are necessary to prevent serious effects of heat exhaustion and heat stroke.

This year's annual update on the incidence of heat illness among U.S. active duty service members presents the case counts and incidence rates of heat illnesses between 2018 and 2022, as well as the locations of heat illness case occurrences during this period. Heat stroke and heat exhaustion are summarized separately.

Skip subpage navigation
Refine your search
Last Updated: July 11, 2023
Follow us on Instagram Follow us on LinkedIn Follow us on Facebook Follow us on X Follow us on YouTube Sign up on GovDelivery