Abstract
During 2008–2018, a total of 12,582 active component service members received incident diagnoses of any diabetes mellitus (DM), for a crude overall incidence rate of 84.8 per 100,000 person-years. More than four-fifths of incident cases were type 2 DM. The overall rates of this form of DM among Asian/Pacific Islander and non-Hispanic black active and reserve component service members were 1.5 or more times the rates among their respective counterparts in other race/ethnicity groups. Crude annual rates of type 2 DM diagnoses among active and reserve component members peaked in 2010 and then decreased to their lowest points in 2018. From 2010 through 2018, decreases in rates of incident type 2 DM diagnoses were observed among active and reserve component members in all subgroups examined (sex, age, race/ethnicity, service), with the greatest slopes of decline seen among service members aged 40 years or older, Asian/Pacific Islanders, and Army members. During 2008–2018, total counts of incident diagnoses of type 2 DM among Military Health System (MHS) dependents decreased by 66.0%, from 29,625 to 10,066. The overall crude prevalence of gestational DM ranged from 7.3% among active component service women to 8.4% among female MHS dependents. Comparisons to data from U.S. civilian populations are made when appropriate.
What Are the New Findings?
During the 11-year surveillance period, annual incidence rates of type 2 DM decreased steadily among service members in the active component (57.7% decline) and reserve component (56.9%) and among MHS dependents (66.0%). Crude annual prevalence rates of gestational DM approximately doubled among women in the active and reserve component and among female MHS dependents.
What Is the Impact on Readiness and Force Health Protection?
Although the incidence rates of DM have been decreasing among service members and dependents, DM presents barriers to the ability of service members to fully participate in military operations, especially those involving deployment. Efforts to sustain the health of the force should include continued surveillance of DM incidence, ongoing research and preventive measures to reduce comorbidities and risk factors, and modification of lifestyle choices and habits to reduce the risk of developing DM.
Background
Diabetes mellitus (DM) is a group of chronic metabolic conditions characterized by high blood glucose levels (hyperglycemia) resulting from a decreased ability to produce and/or use insulin. Over the long term, high blood glucose levels and other DM-related metabolic abnormalities are associated with complications including heart disease, vision loss, and kidney damage.1 The total cost of diagnosed diabetes (types 1 and 2) in the U.S. in 2017 was estimated at $327 billion, including $237 billion in direct costs and $90 billion in reduced productivity.2 Comorbidities accounted for a large portion of the medical costs associated with diabetes.2
Type 1 DM is generally first diagnosed in children and young adults and is characterized by a severe impairment of insulin production due to autoimmune destruction of pancreatic ß-cells, leading to absolute insulin deficiency.1 Usually diagnosed later in life, type 2 DM is the more common form, accounting for over 90% of all diagnosed adult cases.1 Type 2 DM develops when there is a diminished response to the action of insulin (insulin resistance) in muscle, liver, and fat cells; as a result, the pancreas produces more insulin to help glucose enter cells.1 Over time, ß-cell insulin secretion is insufficient to compensate for insulin resistance and blood glucose levels rise.3 Obesity; older age; family history of type 2 DM (first-degree relative); being of Asian or Pacific Islander, non-Hispanic black, Hispanic, or American Indian descent; hypertension or dyslipidemia; and a sedentary lifestyle are key risk factors for type 2 DM.1,3,4 Recent analyses of data from the National Health Interview Survey (NHIS) indicated that annual age-adjusted incidence rates of diagnosed DM among adults aged 18 years or older in the U.S. civilian population decreased significantly, from 7.8 per 1,000 persons in 2009 to 6.0 per 1,000 persons in 2017.5 This decline in the rate of incident cases of diagnosed DM came after decades of increases and appears to be driven primarily by a decrease among non-Hispanic whites.5
Gestational diabetes mellitus (GDM) is generally defined as glucose intolerance with onset or first recognition during pregnancy.6 GDM develops during pregnancy in women whose pancreatic function is insufficient to overcome the insulin resistance secondary to increased release of placental lactogen and other hormones (e.g., growth hormone, Click to closeestrogenAny of a group of steroid hormones which promote the development and maintenance of female characteristics of the body. Such hormones are also produced artificially for use in oral contraceptives or to treat menopausal and menstrual disorders.estrogen, progesterone, prolactin).7 Women with GDM are at considerably increased risk for pregnancy and delivery complications, including fetal macrosomia, preeclampsia, neonatal hypoglycemia, and cesarean delivery.6,8 Major risk factors for GDM include history of GDM, older maternal age, overweight and obesity, family history of DM (first-degree relative), polycystic ovary syndrome, non-white race, hypertension, and hyperlipidemia.1,6,9,10
GDM is estimated to affect 1–14% of pregnancies each year in the U.S., depending on the characteristics of the population studied, diagnostic criteria used, and the method of case ascertainment employed.11–14 In the U.S., the prevalence of GDM varies among race/ethnicity groups, generally corresponding to the prevalence of type 2 DM, with higher rates among non-Hispanic black, Hispanic, American Indian, Pacific Islander, and Asian (South or East Asian) women compared to non-Hispanic white women.15 Prevalence of GDM in the U.S. has been increasing over time, possibly because of increasing maternal overweight and obesity during pregnancy and older age at child bearing.13,15–17 Women who are affected by GDM have more than a 7-fold increased risk of developing type 2 DM later in life compared to those who have a pregnancy without GDM.18 Up to half of all women with GDM progress to develop type 2 DM, with the highest occurrence rate in the first 5 years after pregnancy.18–22
DM of any type is a disqualifying condition for entry into U.S. military service, and the U.S. Armed Forces require service members to meet physical fitness and anthropometric standards.23,24However, despite adherence to physical fitness standards, service members remain at risk of developing DM. A 2017 MSMR analysis of administrative data from the Military Health System (MHS) estimated that during 2008–2015, an annual average of 1,135 active component service members received incident clinical diagnoses of DM.25 The current analysis updates and expands on this earlier work by describing the incidence of DM diagnoses and the prevalence of GDM diagnoses among active and reserve component service members and MHS dependents (i.e., family members) during 2008–2018. In addition, estimates of the percentage of women who progressed from GDM to type 2 DM and the percentage of women who progressed from type 2 DM to GDM are reported.
Methods
The surveillance period was Jan. 1, 2008 to Dec. 31, 2018. The surveillance population included all active and reserve component service members in the U.S. Army, Navy, Air Force, and Marine Corps, as well as family member dependents. Diagnoses of DM and GDM were ascertained from records maintained in the Defense Medical Surveillance System (DMSS) that document inpatient and outpatient encounters of service members and non-service member beneficiaries. Such records reflect care in fixed military treatment facilities of the MHS and in civilian sources of health care underwritten by the Department of Defense (DOD).
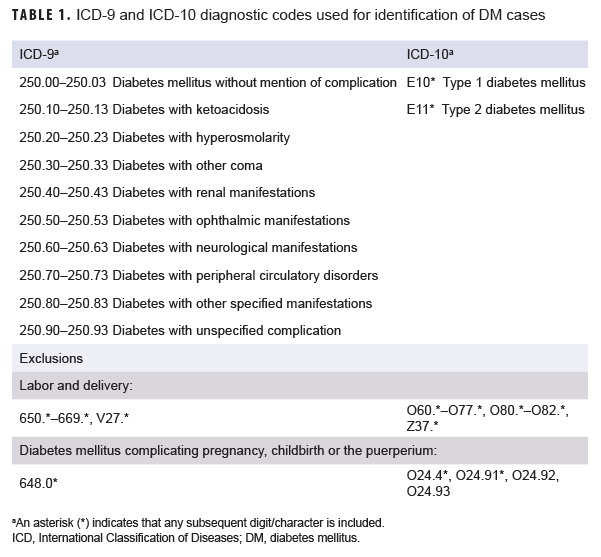
A case of DM was defined by having a record of 2 or more inpatient or outpatient medical encounters occurring within 90 days of each other, with any of the defining diagnoses of type 1 or type 2 DM in the first diagnostic position (Table 1). Individuals were classified as type 1 or 2 cases based on the diagnoses reported in the 2 case-defining encounters. If both type 1 and type 2 DM diagnoses were reported during an individual's 2 case-defining medical encounters, the individual was classified as having an "unspecified" type of DM. For women, inpatient medical encounters with a DM diagnosis were excluded if there was also a diagnosis for labor and delivery (International Classification of Diseases [ICD]-9: 650.*–669.*, V27.*; ICD-10: O60.*–O77.*, O80.*–O82.*, Z37.*) in any diagnostic position within 6 months after the encounter. DM encounters with an additional diagnosis of "diabetes mellitus complicating pregnancy childbirth or the puerperium" (ICD-9: 648.0*; ICD-10: O24.4*, O24.91*, O24.92, O24.93) in any diagnostic position were also excluded. These encounters were excluded because of the assumption that the diagnosis was truly for GDM.
The incidence date for DM was the date of the first inpatient or outpatient encounter that included a diagnosis of DM. For the incidence analysis, an individual was considered an incident case only once per lifetime. Prevalent cases (i.e., cases occurring before the start of the surveillance period) were excluded, and active component person-time was censored at the time of the incident case diagnosis. For the reserve component, service members were counted in the denominator for each year that they did not have an incident DM diagnosis in any previous year.
For active component service members, incidence rates of DM were calculated per 100,000 person-years (p-yrs). For reserve component service members, incidence rates of DM were calculated per 100,000 persons because p-yrs for activated service time were not available. For dependents, only counts of incident cases of DM were described since the DMSS does not contain denominator data for non-service member beneficiaries.
For the prevalence analysis, prevalent cases were defined as individuals who 1) met criteria for becoming an incident case of DM, including cases before 2008, and 2) had a DM diagnosis in the first diagnostic position for any type of DM in an inpatient or outpatient encounter during the given calendar year. For service members, prevalence was calculated as the number of prevalent cases divided by the total number of service members who served during the specified calendar year. Because the DMSS does not contain denominator data for non-service members, only the number of prevalent cases among dependents was ascertained.
A woman was considered a case of GDM if she had an inpatient encounter with a live birth diagnosis (ICD-9: V27.* [excluding V27.1, V27.4, V27.7]; ICD-10: Z37.* [excluding Z37.1, Z37.4, Z37.7]) in any diagnostic position plus at least 1 of the following between 280 days before and 7 days after the delivery event: 1) an inpatient or outpatient encounter with a GDM diagnosis (ICD-9: 648.0*; ICD-10: O24.4*, O24.91*, O24.92, O24.93) in any diagnostic position, 2) an inpatient encounter with a diagnosis for abnormal glucose tolerance (ICD-9: 648.8*; ICD-10: O99.81*) in any diagnostic position, or 3) 2 or more outpatient encounters at least 7 days apart with a diagnosis of abnormal glucose tolerance (ICD-9: 648.8*; ICD-10: O99.81*) in any diagnostic position. Women with a prior diagnosis of DM (ICD-9: 250.*; ICD-10: E10.*, E11.*) in any diagnostic position of an inpatient or outpatient encounter were excluded from the analysis.
The denominator for calculating the prevalence rate of GDM was the number of live births in each calendar year. A new live birth was eligible to be counted once every 280 days.26 Of these births, the proportion of those with an associated GDM diagnosis was calculated. The reference date for assigning the year of the birth and the GDM diagnosis was the date of the inpatient admission for the live birth. Prevalence rates were calculated per 100 live births.
The number of women who were diagnosed as an incident case of GDM who later met criteria for becoming a case of DM was also described. For this calculation, incident cases of DM were reascertained so that some of the previously described exclusion criteria could be relaxed. In particular, in counting incident cases of DM, encounters for DM were not excluded if there was a diagnosis for labor and delivery within 6 months after the encounter. Additionally, the number of women with incident type 2 DM who were later diagnosed as a case of GDM was determined.
For this analysis, incident cases of GDM were reascertained again to relax the exclusion criteria. Specifically, GDM cases with a prior diagnosis of DM were not excluded. Finally, for active component service women, follow-up period was calculated as the time from incident diagnosis (GDM or type 2 DM) to the time of their departure from service or the end of the study period, whichever came first. Follow-up period was not calculated for reserve component service women because information on the start and end dates of their active duty service periods was not available.
Results
Diabetes Mellitus
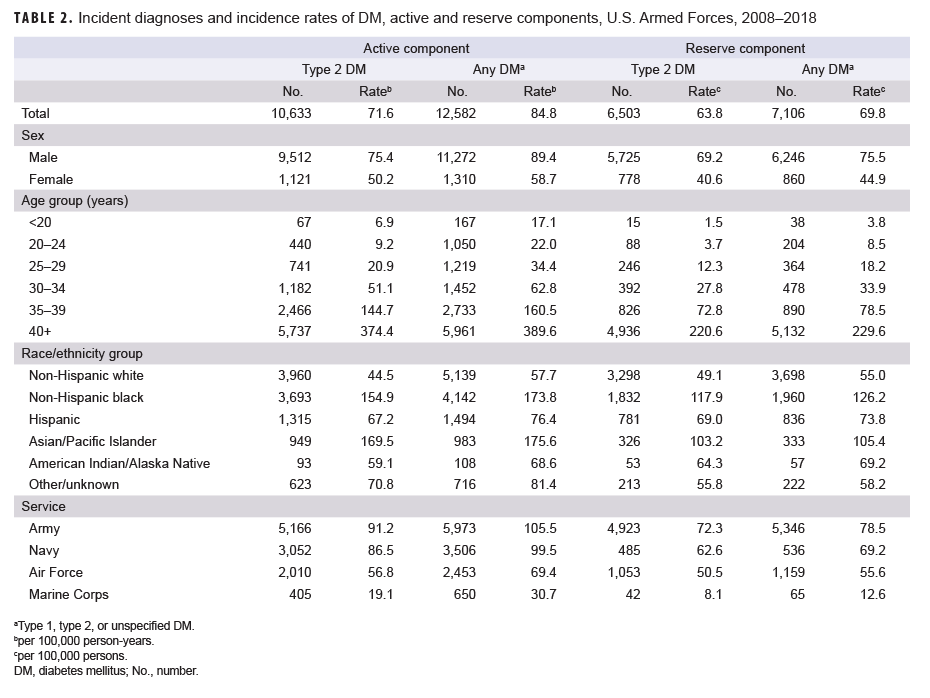
Active component: During 2008–2018, a total of 12,582 active component service members received incident diagnoses of any DM, for a crude overall incidence rate of 84.8 per 100,000 p-yrs (Table 2). More than four-fifths (n=10,633; 84.5%) of incident cases were type 2 DM. The crude overall incidence rate of type 2 DM was 71.6 per 100,000 p-yrs.
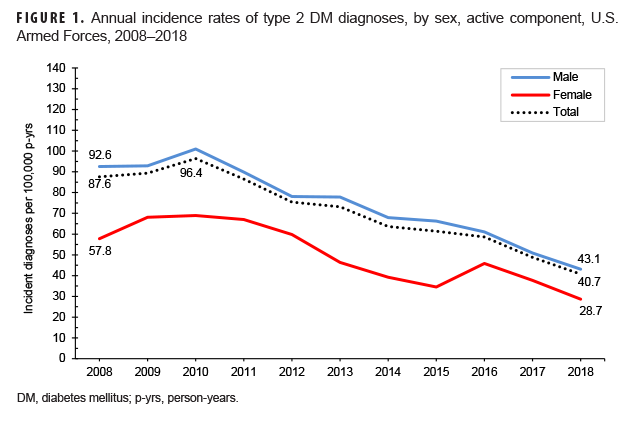
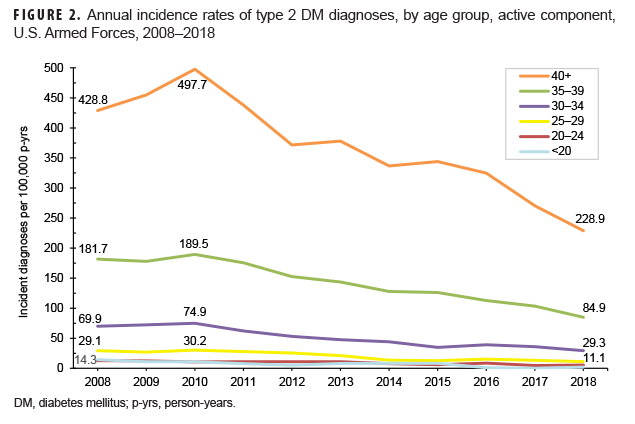
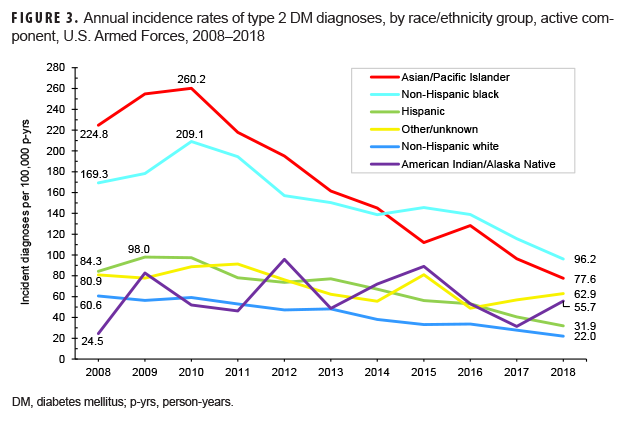
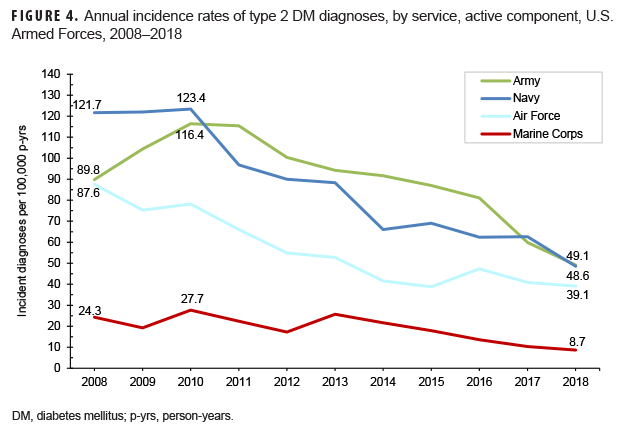
Among active component service members, overall incidence rates of type 2 DM diagnoses increased exponentially with increasing age (Table 2). Male service members had an overall rate 1.5 times that among females (75.4 per 100,000 p-yrs and 50.2 per 100,000 p-yrs, respectively). The overall rates of type 2 DM diagnoses were highest among Asian/Pacific Islanders (169.5 per 100,000 p-yrs) and non-Hispanic blacks (154.9 per 100,000 p-yrs) and lowest among non-Hispanic whites (44.5 per 100,000 p-yrs). Across the services, crude overall incidence rates of type 2 DM diagnoses were highest among Army and Navy members (91.2 per 100,000 p-yrs and 86.5 per 100,000 p-yrs, respectively) and lowest among Marine Corps members (19.1 per 100,000 p-yrs).
Crude annual incidence rates of type 2 DM diagnoses among active component service members peaked in 2010 at 96.4 per 100,000 p-yrs and then decreased by almost three-fifths to 40.7 per 100,000 p-yrs in 2018 (Figure 1). During this 9-year period, decreases in rates of incident type 2 DM diagnoses occurred in both sexes, in all age groups, among all race/ethnicity groups, and across all services (Figures 1–4). Between 2010 and 2018, the slope of decline in annual rates was greatest for service members aged 40 years or older, with slopes decreasing with decreasing age (Figure 2). The slope of decline during this period was greatest among Asian/Pacific Islander service members and smallest among non-Hispanic white service members (Figure 3). Across the services, the slope of decline during 2010–2018 was greatest among Army and Navy members and smallest among Marine Corps members (Figure 4).
Reserve component: During the 11-year surveillance period, a total of 7,106 reserve component service members received incident diagnoses of any DM, for a crude overall incidence rate of 69.8 per 100,000 persons (Table 2). The vast majority (n=6,503; 91.5%) of incident cases were type 2 DM. The crude overall incidence rate of type 2 DM was 63.8 per 100,000 persons. With the exception of race/ethnicity group, patterns of subgroup-specific overall rates of type 2 DM among reserve component service members were similar to those noted among active component members, with the highest rates observed in males, those aged 40 years or older, and Army members. Among reserve component service members, non-Hispanic blacks had the highest rate of type 2 DM (Table 2).
Crude annual incidence rates of type 2 DM diagnoses among reserve component service members peaked in 2010 at 92.7 per 100,000 persons and then decreased by more than half to 40.0 per 100,000 persons in 2018 (data not shown). As was observed among active component members during the period from 2010 through 2018, decreases in rates of incident type 2 DM diagnoses occurred in both sexes, in all age groups, among all race/ethnicity groups, and across all services, with the greatest slopes of decline among service members aged 40 years or older, Asian/Pacific Islander service members, and Army members (data not shown).
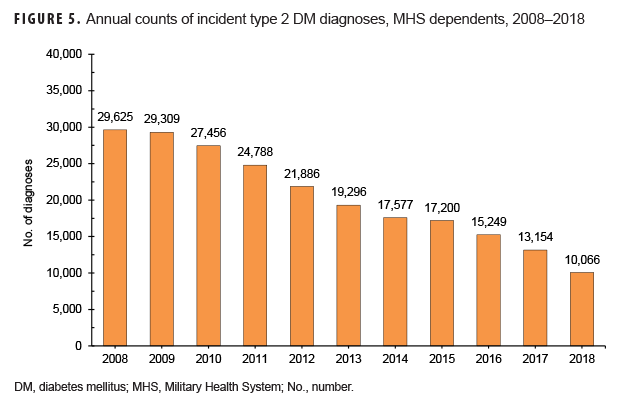
MHS dependents: From 2008 through 2018, a total of 249,394 MHS dependents received any incident DM diagnoses, 90.5% of whom were affected by type 2 DM (data not shown). The vast majority of dependents diagnosed with type 2 DM were female (94.2%) and 45 years or older (86.9%) (data not shown). Over the course of the 11-year period, total counts of incident diagnoses of type 2 DM in this population decreased by 66.0%, from 29,625 to 10,066 (Figure 5).
Gestational Diabetes Mellitus
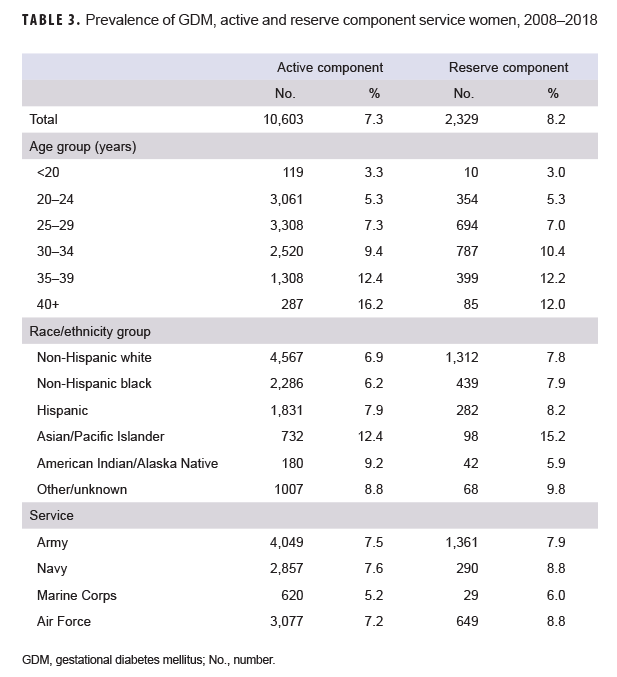
Active component: Between 2008 and 2018, 7.3% (n=10,603) of the total live births to active component service women were associated with a diagnosis of GDM (Table 3). Overall prevalence of GDM increased with increasing age and was highest among Asian/Pacific Islander service women (12.4% of total live births). Across the services, overall prevalence of GDM ranged from 5.2% among female Marine Corps members to 7.6% among female Navy members.
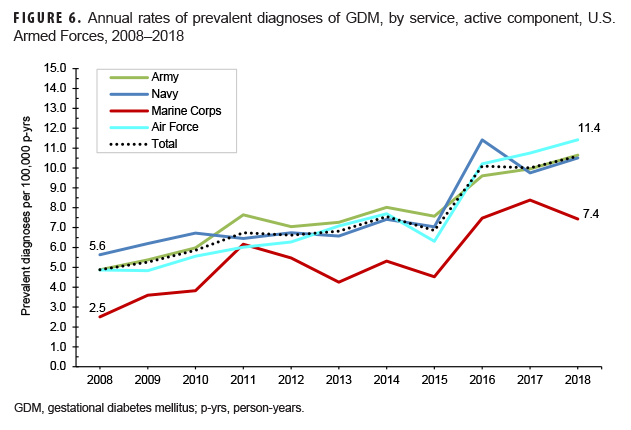
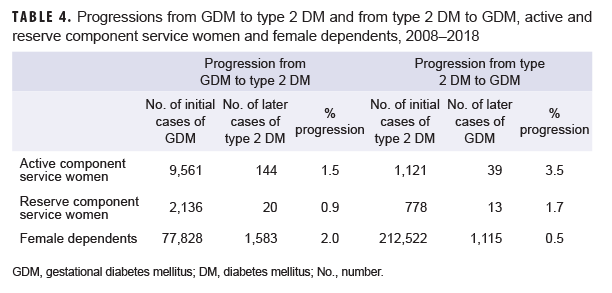
Overall, crude annual prevalence rates of GDM among active component service women more than doubled from 4.9 per 100 live births in 2008 to 10.6 per 100 live births in 2018 (Figure 6). This increase in prevalence rates over time was observed in all subgroups examined (sex, age, race/ethnicity, service). Among active component service women, 1.5% of women with incident GDM diagnoses were later diagnosed with type 2 DM (Table 4); more than three-quarters (76.4%) of these women were diagnosed with type 2 DM within 5 years of their incident GDM diagnoses (data not shown). The average follow-up period for service women after their incident GDM diagnosis was 3.1 years (data not shown). Conversely, 3.5% of women with incident type 2 DM diagnoses were later diagnosed with GDM; the majority (76.9%) of these service women developed GDM within 5 years of their incident type 2 DM diagnoses (data not shown). The average follow-up period for women after their incident type 2 DM diagnosis was 2.5 years (data not shown).
Reserve component: During the 11-year surveillance period, 8.2% (n=2,329) of the total live births to reserve component service women were associated with a diagnosis of GDM (Table 3). Overall prevalence of GDM generally increased with increasing age and was highest among Asian/Pacific Islander service women (15.2% of total live births). Across the services, overall prevalence of GDM ranged between 6.0% among female Marine Corps members and 8.8% among female Navy and Air Force members.
Overall, crude annual prevalence rates of GDM among reserve component service women nearly doubled from 6.8 per 100 live births in 2008 to 13.0 per 100 live births in 2018 (data not shown). This increase in prevalence rates over time was observed in all subgroups examined (age, race, service). Among reserve component service women, 0.9% of women with incident GDM were later diagnosed with type 2 DM (Table 4); nearly two-thirds (65.0%) were diagnosed with type 2 DM within 5 years of their incident GDM diagnoses (data not shown). Of the women with incident type 2 DM diagnoses, 1.7% were later diagnosed with GDM (Table 4); the vast majority (92.3%) of these women were diagnosed with GDM within 5 years of their incident type 2 DM diagnoses (data not shown).
MHS dependents: Of the total live births to female MHS dependents during 2008–2018, 8.4% (n=87,813) were associated with a diagnosis of GDM (data not shown). As was observed among active and reserve component service women, overall prevalence of GDM among female dependents increased with increasing age (data not shown).
Crude annual prevalence rates of GDM among female MHS dependents more than doubled from 6.1 per 100 live births in 2008 to 13.2 per 100 live births in 2018 (data not shown). This increase in prevalence rates over time was observed in all age groups (0–17, 18–44, and 45–64). Among female MHS dependents, 2.0% of women with incident GDM were later diagnosed with type 2 DM (Table 4). Conversely, 0.5% of women with incident type 2 DM were later diagnosed with GDM. As was observed among active and reserve component service women, the majority of female non-service member beneficiaries who developed type 2 DM after having been diagnosed with GDM or who developed GDM after having been diagnosed with type 2 DM did so within 5 years of their initial DM diagnoses (70.1% and 90.9%, respectively) (data not shown).
Editorial Comment
The current analysis found that from 2008 through 2018, the crude annual incidence of type 2 DM diagnoses decreased among active component service members overall and among all subgroups examined; the greatest decrease in crude annual rates of type 2 DM was seen between 2010 and 2018. Although incidence rates of diagnosed DM among adults aged 18 years or older in the U.S. civilian population during this period were considerably higher than among comparably aged active component and reserve component members, the approximate timing of the peaks in rates was somewhat similar; a peak in annual age-adjusted incidence of diagnosed DM was observed in 2009 in the former and 2010 in the latter.5 Potential explanations for the prolonged decrease in type 2 DM incidence observed in both the U.S. military and civilian populations include increased awareness,27 education,27 risk factor modification,28–31 and/or a reduction in the pool of undiagnosed type 2 DM through the intensification of diagnostic and screening activities.32–34 However, recent published reviews have argued that DM risks have not decreased in the U.S. general population sufficiently to explain this trend.33,34
As expected, the majority of incident diagnoses of DM among service members were reported as type 2 cases. The demographic differences in type 2 DM incidence observed in the current analysis are consistent with those documented in civilian populations in the U.S. and elsewhere.1,4–6,34 Males have a higher risk of developing type 2 DM compared to females; incidence increases with age in both sexes.1,4–6 The overall incidence rates of diagnoses of this form of DM among Asian/Pacific Islander and non-Hispanic black active and reserve component service members were 1.5 or more times the rates among their respective counterparts in other race/ethnicity groups. Comparable differences between the incidence of type 2 DM among non-Hispanic blacks and those in other race/ethnicity groups (non-Hispanic whites and Asians) have been reported in the adult civilian U.S. population using 2013–2015 NHIS data.35
Epidemiologic studies and U.S. national surveillance have demonstrated that Asians have a higher prevalence of type 2 DM compared to non-Hispanic whites but a lower prevalence than that of non-Hispanic blacks and Hispanics.36,37 However, disaggregation of Asian/Pacific Islander subgroups has shown that there is considerable variation in incidence within this group, with Pacific Islanders, South Asians, and Filipinos having the highest incidence of diabetes among all race/ethnicity groups.38
Over the 11-year surveillance period, 12,582 active component and 7,106 reserve component service members received clinical diagnoses of DM. Using 2015–2016 National Health and Nutrition Examination Survey (NHANES) data, the Centers for Disease Control and Prevention (CDC) estimated that among the 5.6% of U.S. adults aged 20–44 years with DM, 2.4% were undiagnosed.39 Prevalences of both diagnosed and undiagnosed DM would be expected to be much lower among U.S. service members than similarly aged U.S. civilians because of disqualifying standards for enlistment (i.e., having a history of DM, unresolved pre-DM1 within the last 2 years, or GDM), height and weight requirements that discourage obesity,24 and mandatory medical examinations in addition to free access to health care.
Military medical retention standards require that service members diagnosed with DM while in service and who have a hemoglobin A1c (HbA1c) level "greater than 7.0% despite lifestyle modification for 6 months, intolerance, or declination of medical therapy" be referred to a medical evaluation board, which assesses their medical fitness and makes recommendations about follow-up care.23 Having a chronic condition such as DM does not necessarily preclude continued military service; factors such as occupation and severity of disease affect the decision regarding continuation of military service. As described in the Department of Defense Instruction (DODI) 6490.07,40 medical evaluators must consider rations, duty assignment, and medical services available in theater when deciding whether an individual with DM is deployable. A waiver allowing deployment is permissible by which certain service members with DM can take part in "contingency deployments." A contingency is defined as "a situation requiring military operations in response to natural disasters, terrorists, subversives, or as directed by appropriate authority to protect U.S. interests."40 A contingency deployment is defined as "a deployment that is limited to outside the continental U.S., over 30 days in duration, and in a location with medical support from only nonfixed (temporary) military medical treatment facilities." 40 A minimum of a medical record review by a trained DOD health care provider is required to determine whether a service member with a chronic medical condition can deploy; this determination is based on the severity and stability of the condition, as well as the environment and other requirements that may be anticipated during deployment.39 DM type 1 or 2 treated with insulin or oral hypoglycemic agents is specifically identified in DODI 6490.07 as a high-risk condition, as the disease and certain medications for its treatment could cause sudden incapacitation.40 A recent study of U.S. Army, Navy, Air Force, and Marine Corps members with DM who had at least 1 deployment during 2005–2017 and for whom paired pre- and post-deployment HbA1c data were available (n=474) demonstrated that Hb1Ac levels remained stable for those who met adequate glycemic targets (less than 7.0%).41
As described in DODI 6025.19,42 individual medical readiness requires an annual periodic health assessment that provides an opportunity to assess the overall health and medical readiness status of each service member. Consequently, the military departments may initiate preventive services as warranted, refer service members to the primary health care provider for further evaluation as indicated, and document any further plan that may be needed. Service members may therefore be more educated and informed regarding DM risk factors and disease symptoms. As a result, higher proportions of detectable cases may be identified among them. The higher crude overall rates of DM diagnoses in the Army and the Navy likely reflect, at least in part, different demographic makeups (e.g., Marine Corps members are, on average, younger than other services' personnel43), varying frequencies and intensities of physical activity (military and/or leisure), and/or more complete and timely case identification in these services than in the other services. Any further investigation of these differences should examine adjusted (e.g., by age, sex, race/ethnicity) incidence rates among members within the services. It is important to note that the prevalence of obesity in the identified DM cases was not examined in this analysis but would be relevant to potential studies of adjusted rates of this condition across the services.
In the current analysis, the overall crude prevalence of GDM ranged from 7.3% among active component service women to 8.4% among female MHS dependents. This range of prevalence estimates aligns with previous studies in U.S. subpopulations.11–17,22,44,45 Analysis of 2007–2010 data from the CDC's Pregnancy Risk Assessment Monitoring System found that GDM prevalence ranged from 4.6% to 9.2% depending on the method of report (4.6% based on birth certificates, 8.7% as reported by questionnaire, and 9.2% based on either method).11 An analysis of 2012–2016 MHS administrative data from active component service women yielded GDM prevalence estimates that ranged from 5.8% to 6.8%, with the highest rates among those in the oldest age group.46 In the current analysis, increases in annual prevalence rates over time were observed in all subgroups examined (age, race/ethnicity, service). The U.S. civilian population has experienced similar increases in the prevalence of GDM.11,13,15,16
Among female service members and MHS dependents with GDM, between 0.9% (reserve component) and 2.0% (dependents) had subsequent diagnoses of type 2 DM. Estimates of progression from GDM to type 2 DM among women in the U.S. civilian population are considerably higher and range from 15% to 50% depending on the characteristics of the population studied, diagnostic criteria employed, method of report, and follow-up period.18–22,42,47 It is important to note that the lack of comparability of these studies precludes direct comparison to the current results. Regardless of the relatively low estimates of conversion, the current findings highlight the public health importance of diabetes education, testing, and ongoing clinical follow up for diabetes well beyond the traditional 6-month postpartum time period.
Several limitations should be considered when interpreting the results of the current analysis. First, incident cases of DM were ascertained from diagnosis codes recorded on administrative records of medical encounters. The reliability of diagnoses of DM on such records may be variable (e.g., some encounters that raise clinical suspicion of or "rule out" DM may be incorrectly documented with diagnostic codes specific for DM). To increase the likelihood that individuals with DM diagnosis codes were true cases, the surveillance case definition required at least 2 medical encounters with primary diagnoses of DM within a 90-day period. In addition, this report summarized diagnoses of DM that were reported from medical encounters in fixed U.S. military and civilian (i.e., Click to closePurchased CareThe TRICARE Health Program is often referred to as purchased care. It is the services we “purchase” through the managed care support contracts.purchased care) medical facilities if reimbursed through the MHS. Because records of civilian health care not reimbursed by the MHS were not available for this analysis, the numbers and rates of incident diagnoses of DM reported here are likely an underestimate of the actual numbers and rates of incident diagnoses of this condition.
It is predicted that approximately 1 in 3 people with diabetes are undiagnosed.48 The changing demographics of the obstetric population, including advanced maternal age and obesity, have led to an increasing number of women entering pregnancy with unrecognized diabetes.49 Thus, in the current study, some of the women with GDM who later developed type 2 DM likely represent previously undiagnosed type 2 DM that was first recognized during screening in pregnancy. However, unlike the civilian population, where testing for diabetes in women at high risk may not occur before an unplanned conception, active and reserve component service women of reproductive age are routinely screened before conception.
DM is one of the costliest diseases in the U.S. During 1996–2013, health care spending on DM increased twice as fast as all other conditions combined, with the highest annual growth rates seen among those aged 20–44 years.50 Despite declines in incidence of type 2 DM diagnoses among active and reserve component service members over the course of the last 8 years of the surveillance period, sustained surveillance of DM along with continued research on comorbidities, risk factors, and lifestyle choices on DM incidence are warranted.
Author affiliations: Defense Health Agency, Armed Forces Health Surveillance Branch (Ms. Williams, Mr. Oh, Dr. Stahlman); Department of Defense, Office of the Assistant Secretary of Defense for Health Affairs (Dr. Shell).
Disclaimer: The views expressed are those of the authors and do not reflect the official policy or position of the Department of Defense or the U.S. Government.
References
- American Diabetes Association. 2. Classification and diagnosis of diabetes: Standards of Medical Care in Diabetes—2019. Diabetes Care. 2019;42(suppl 1):s13–s28.
- American Diabetes Association. Economic costs of diabetes in 2017. Diabetes Care. 2018;41(5):917–928.
- White MG, Shaw JA, Taylor R. Type 2 diabetes: the pathologic basis of reversible ß-cell dysfunction. Diabetes Care. 2016;39(11):2080–2088.
- Forouhi NG, Wareham NJ. Epidemiology of diabetes. Medicine (Abingdon). 2014;42(12):698–702.
- Benoit SR, Hora I, Albright AL, Gregg EW. New directions in incidence and prevalence of diagnosed diabetes in the USA. BMJ Open Diabetes Res Care. 2019;7(1):e000657.
- Galtier F. Definition, epidemiology, risk factors. Diabetes Metab. 2010;36(6 pt 2):628–651.
- Songara AD, Birada SM, KD, Murthy DSJ. Normal pregnancy—a state of insulin resistance. J Clin Diagn Res. 2014;8(11):CC01–CC03.
- Feig DS, Hwee J, Shah BR, et al. Trends in incidence of diabetes in pregnancy and serious perinatal outcomes: a large, population-based study in Ontario, Canada, 1996–2010. Diabetes Care. 2014; 37:1590.
- Committee on Practice Bulletins—Obstetrics. ACOG Practice Bulletin No. 190: Gestational Diabetes Mellitus. Obstet Gynecol. 2018;131:e49–e64.
- Moyer VA, U.S. Preventive Services Task Force. Screening for gestational diabetes mellitus: U.S. Preventive Services Task Force recommendation statement. Ann Intern Med. 2014;160(6):414–420.
- DeSisto CL, Kim SY, Sharma AJ. Prevalence estimates of gestational diabetes mellitus in the United States, Pregnancy Risk Assessment Monitoring System (PRAMS), 2007–2010. Prev Chronic Dis. 2014;11:e104.
- Correa A, Bardenheier B, Elixhauser A, Geiss LS, Gregg E. Trends in prevalence of diabetes among delivery hospitalizations, United States, 1993–2009. Matern Child Health J. 2015;19(3):635–642.
- Kim SY, Saraiva C, Curtis M, Wilson HG, Troyan J, Sharma AJ. Fraction of gestational diabetes mellitus attributable to overweight and obesity by race/ethnicity, California, 2007–2009. Am J Public Health. 2013;103(10):e65–72.
- Hedderson M, Ehrlich S, Sridhar S, Darbinian J, Moore S, Ferrara A. Racial/ethnic disparities in the prevalence of gestational diabetes mellitus by BMI. Diabetes Care. 2012;35(7):1492–1498.
- Ferrara A. Increasing prevalence of gestational diabetes mellitus: a public health perspective. Diabetes Care. 2007;30 (suppl 2):s141–s146.
- Getahun D, Nath C, Ananth CV, et al. Gestational diabetes in the United States: temporal trends 1989 through 2004. Am J Obstet Gynecol. 2008;198(5):525.e1–e5.
- Bardenheier BH, Elixhauser A, Imperatore G, et al. Variation in prevalence of gestational diabetes mellitus among hospital discharges for obstetric delivery across 23 states in the United States. Diabetes Care. 2013;36(5):1209–1214.
- Bellamy L, Casas JP, Hingorani AD, Williams D. Type 2 diabetes mellitus after gestational diabetes: a systematic review and meta-analysis. Lancet. 2009;373(9677):1773–1779.
- Oldfield MD, Donley P, Walwyn L, Scudamore I, Gregory R. Long term prognosis of women with gestational diabetes in a multiethnic population. Postgrad Med J. 2007;83(980):426–430.
- Metzger BE, Buchanan TA, Coustan DR, et al. Summary and recommendations of the fifth international workshop-conference on gestational diabetes mellitus. Diabetes Care. 2007;30(suppl 2):s251–s260.
- Rayanagoudar G, Hashi AA, Zamora J, Khan KS, Hitman GA, Thangaratinam S. Quantification of the type 2 diabetes risk in women with gestational diabetes: a systematic review and meta-analysis of 95,750 women. Diabetologia. 2016;59(7):1403–1411.
- Casagrande SS, Linder B, Cowie CC. Prevalence of gestational diabetes and subsequent type 2 diabetes among U.S. women. Diabetes Res Clin Pract. 2018;141:200–208.
- Office of the Under Secretary of Defense for Personnel and Readiness. Department of Defense Instruction 6130.03. Medical Standards for Appointment, Enlistment, or Induction in the Military Services. 6 May 2018.
- Headquarters, Departments of the Army, the Navy, the Air Force, and the Coast Guard. Army Regulation 40-501. Standards of Medical Fitness. 27 June 2019.
- Williams VF, Stahlman S, Hu Z. Diabetes mellitus, active component, U.S. Armed Forces, 2008–2015. MSMR. 2017;24(1):8–11.
- Stahlman S, Witkop CT, Clark LC, Taubman SB. Pregnancies and live births, active component service women, U.S. Armed Forces, 2012–2016. MSMR. 2017;24(11):2–9.
- Dietz WH, Solomon LS, Pronk N, et al. An integrated framework for the prevention and treatment of obesity and its related chronic diseases. Health Aff (Millwood). 2015;34(9):1456–1463.
- Park S, Xu F, Town M, Blanck HM. Prevalence of sugar-sweetened beverage intake among adults–23 states and the District of Columbia, 2013. MMWR Morb Mortal Wkly Rep. 2016;65(7):169–174.
- Wang DD, Leung CW, Li Y, et al. Trends in dietary quality among adults in the United States, 1999 through 2010. JAMA Intern Med. 2014;174(10):1587–1595.
- Ford ES, Dietz WH. Trends in energy intake among adults in the United States: findings from NHANES. Am J Clin Nutr. 2013;97(4):848–853.
- Ng SW, Slining MM, Popkin BM. Turning point for US diets? Recessionary effects or behavioral shifts in foods purchased and consumed. Am J Clin Nutr. 2014;99(3):609–616.
- Rasmussen SS, Johansen NB, Witte DR, et al. Incidence of register-based diabetes 10 years after a stepwise diabetes screening programme: the ADDITION-Denmark study. Diabetologia. 2016;59(5):989–997.
- Selvin E, Ali MK. Declines in the incidence of diabetes in the U.S.–real progress or artifact? Diabetes Care. 2017;40(9):1139–1343.
- Magliano DJ, Islam RM, Barr ELM, et al. Trends in incidence of total or type 2 diabetes: systematic review. BMJ. 2019;366:i5003.
- Centers for Disease Control and Prevention. National Diabetes Statistics Report, 2017. Atlanta, GA: Centers for Disease Control and Prevention, U.S. Department of Health and Human Services; 2017.
- Lee JW, Brancati FL, Yeh HC. Trends in the prevalence of type 2 diabetes in Asians versus whites: results from the United States National Health Interview Survey, 1997–2008. Diabetes Care. 2011;34:353–357.
- Kirtland KA, Cho P, Geiss LS. Diabetes among Asians and Native Hawaiians or other Pacific Islanders—United States, 2011–2014. MMWR Morb Mortal Wkly Rep. 2015;64(45):1261–1266.
- Karter AJ, Schillinger D, Adams AS, et al. Elevated rates of diabetes in Pacific Islanders and Asian subgroups: The Diabetes Study of Northern California (DISTANCE). Diabetes Care. 2013;36(3):574–579.
- National Center for Health Statistics. Health, United States, 2018. Hyattsville, MD: Centers for Disease Control and Prevention, U.S. Department of Health and Human Services; 2019.
- Office of the Under Secretary of Defense for Personnel and Readiness. Department of Defense Instruction 6490.07. Deployment-Limiting Medical Conditions for Service Members and DOD Civilian Employees. 5 Feb. 2010.
- Folaron I, True MW, Kazanis WH, et al. Diabetes by air, land, and sea: effects of deployments on HbA1c and BMI [published online ahead of print 17 October 2019]. Mil Med. 2019;pii:usz311.
- Office of the Under Secretary of Defense for Personnel and Readiness. Department of Defense Instruction 6025.19. Individual Medical Readiness. 9 June 2014.
- Department of Defense, Office of the Deputy Assistant Secretary of Defense for Military Community and Family Policy. 2017 Demographics: Profile of the Military Community. Washington, DC; 2018.
- Hunsberger M, Rosenberg KD, Donatelle RJ. Racial/ethnic disparities in gestational diabetes mellitus: findings from a population-based survey. Womens Health Issues. 2010;20(5):323–328.
- Bentley-Lewis R, Dawson DL, Wenger JB, Thadhani RI, Roberts DJ. Placental histomorphometry in gestational diabetes mellitus: the relationship between subsequent type 2 diabetes mellitus and race/ethnicity. Am J Clin Pathol. 2014;141(4):587–592.
- Stahlman S, Witkop CT, Clark LL, Taubman SB. Complications and care related to pregnancy, labor, and delivery among active component service women, U.S. Armed Forces, 2012–2016. MSMR. 2017;24(11):22–29.
- Bao W, Yeung E, Tobias DK, et al. Long-term risk of type 2 diabetes mellitus in relation to BMI and weight change among women with a history of gestational diabetes mellitus: a prospective cohort study. Diabetologia. 2015;58(6):1212–1219.
- Cowie CC, Rust KF, Byrd-Holt DD, et al. Prevalence of diabetes and impaired fasting glucose in adults in the U.S. population: National Health and Nutrition Examination Survey 1999–2002. Diabetes Care. 2006;29(6):1263–1268.
- Lawrence JM, Contreras R, Chen W, Sacks DA. Trends in the prevalence of preexisting diabetes and gestational diabetes mellitus among a racially/ethnically diverse population of pregnant women, 1999–2005. Diabetes Care. 2008;31(5):899–904.
- Dieleman JL, Baral R, Birger M, et al. US spending on personal health care and public health, 1996–2013. JAMA. 2016;316(24):2627–2646.