What are the New Findings?
Influenza B was the predominant influenza type starting from the beginning of Nov. 2019. Influenza A(H1N1)pdm09 occurred actively 3 weeks thereafter, and then co-circulated highly with influenza B through the end of March 2020. The estimated VE (46%) indicated that the influenza vaccine during the 2019–2020 influenza season was moderately effective against these influenza viruses.
What is the Impact on Readiness and Force Health Protection?
Influenza surveillance conducted by DODGRS during the 2019–2020 influenza season identified circulating influenza virus (sub)types, provided timely data on the genetic characteristics of the circulating viruses, and estimated influenza VE. These surveillance data and findings help military authorities prioritize health resources and better plan appropriate health intervention measures for DOD service members and their beneficiaries.
Abstract
Laboratory-based influenza surveillance was conducted in the 2019–2020 influenza season among Department of Defense (DOD) beneficiaries through the DOD Global Respiratory Pathogen Surveillance Program (DODGRS). Sentinel and participating sites submitted 28,176 specimens for clinical diagnostic testing. A total of 5,529 influenza-positive cases were identified. Starting at surveillance week 45 (3–9 Nov. 2019), influenza B was the predominant influenza type, followed by high activity of influenza A(H1N1)pdm09 three weeks thereafter. Both influenza B and influenza A(H1N1)pdm09 were then highly co-circulated through surveillance week 13 (22–28 March 2020). End-of-season influenza vaccine effectiveness (VE) was estimated using a test-negative case-control study design. The adjusted end-of-season VE for all beneficiaries, regardless of influenza type or subtype, was 46% (95% confidence interval: 40%–52%). The influenza vaccine was moderately effective against influenza viruses during the 2019–2020 influenza season.
Background
Influenza viruses change from year to year as they undergo constant antigenic drifts and potential antigenic shifts. Because of the changing nature of these viruses, it is crucial to conduct annual surveillance to determine the circulating viruses and to detect changes in the viruses during the influenza season. Seasonal influenza vaccination is considered the main strategy to protect against influenza viruses, combat influenza infection, and reduce disease severity. To improve vaccine effectiveness (VE) against influenza viruses, the strains used in the influenza vaccine need to be updated regularly based on the surveillance findings. Every year, the Department of Defense (DOD) Global Respiratory Pathogen Surveillance Program (DODGRS) performs routine respiratory pathogen surveillance among DOD service members and their beneficiaries, and evaluates influenza VE. The objective of this report is to describe influenza surveillance trends and the end-of season VE estimates among DOD beneficiaries during the 2019–2020 influenza season.
Methods
Surveillance population
The participant selection criteria in DODGRS have been described elsewhere.1,2 Briefly, all participants were selected at sentinel or participating sites throughout the U.S. and around the world, using criteria which meet the influenza-like illness (ILI) case definition. An ILI case is defined as a patient who exhibits a fever greater than or equal to 100.5 °F and a cough or sore throat that presents within 72 hours after illness onset, or has physician-determined ILI. Respiratory specimens were collected by nasopharyngeal wash or nasopharyngeal swab. Each sentinel or participating site was requested to submit 6–10 respiratory specimens per week for laboratory testing. Patients who had received at least 1 influenza vaccine dose 14 days or more before an ILI encounter were considered vaccinated. Vaccination status was verified through the records from the DOD Electronic Immunization Tracking System or self-reported questionnaire for each outpatient.
Laboratory testing
Influenza testing was conducted in 1 of 3 laboratories located within Landstuhl Regional Medical Center, Brooke Army Medical Center, or the U.S. Air Force School of Aerospace Medicine (USAFSAM). The specimens collected from the sentinel and participating sites were processed and subjected to testing via a multiplex respiratory pathogen panel, reverse transcriptase polymerase chain reaction (RT-PCR), and/or viral culture. In this way, the influenza-positive cases and other respiratory pathogens were identified and confirmed. The laboratory-confirmed influenza viruses were further genetically characterized via Illumina next-generation sequencing (NGS) technology and analyzed using the Iterative Refinement Meta-Assembler (IRMA) package,3 BioEdit software,4 and components of the DNASTAR Lasergene Core Suite.5
A test-negative case-control study design was used to estimate influenza VE. The VE analysis was limited to surveillance weeks 46–12 (10 November 2019 to 21 March 2020), when approximately 10% or greater influenza positivity rate occurred, with an aim to minimize any potential bias due to high ratio of controls to cases that would typically occur earlier or later in the influenza season. Service members, due to their usually high influenza vaccination rate (>90%), and outpatients less than 6 months of age were excluded from the VE analysis. Age was categorized into 3 groups (i.e., children: 6 months to 17 years; adults: 18–64 years; and the elderly: 65 years or older). The odds of influenza vaccination among beneficiaries with laboratory-confirmed influenza-positive status (cases) were compared to the odds of influenza vaccination among beneficiaries who tested influenza negative (controls), using backward stepwise multiple logistic regression models in SAS /STAT software, version 9.4 (2014, SAS Institute, Cary, NC). End-of-season VE was calculated as (1 – adjusted odds ratio) × 100% and estimates were presented with their associated 95% confidence intervals (CIs). VE estimates were adjusted for potential confounding factors, such as age group, sex, specimen collection date, and geographical region (i.e., eastern U.S., western U.S., and outside the continental U.S.). A point estimate of VE was considered statistically significant if the 95% CI did not contain zero or a negative value. In addition to VE estimated for all influenza in the entire beneficiary population, VE was estimated against any specific influenza, by influenza virus (sub)types in separate models [i.e., influenza A, A(H1N1)pdm09, A(H3N2), or influenza B], and in stratified models by beneficiary age group (i.e., children, adults, or the elderly).
Results
Influenza virus and other pathogen surveillance
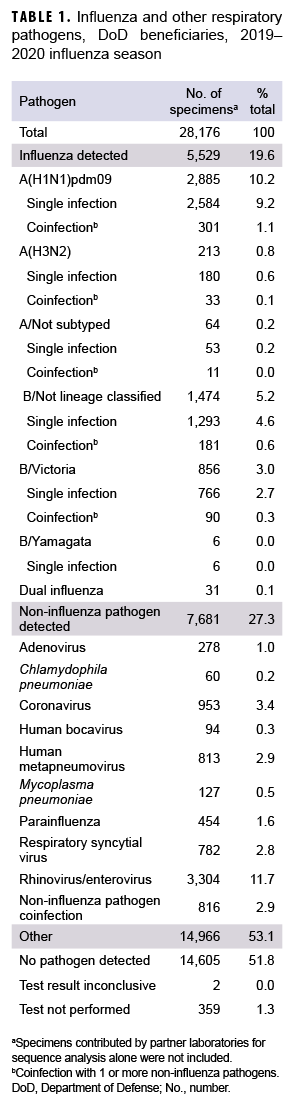
During the 2019–2020 influenza season, a total of 28,176 specimens were collected from 4 commands including 114 geographical locations (Table 1, data not shown). These specimens included 23,466 (83.3%) from U.S. Northern Command, 2,989 (10.6%) from U.S. European Command, 1,699 (6.0%) from U.S. Indo-Pacific Command, and 22 (0.1%) from U.S. Central Command (data not shown). Of those collected, 15,763 (55.9%) specimens were from male outpatients and 12,413 (44.1%) were from female outpatients (data not shown). There were 13,353 (47.4%) specimens collected from service members, 7,091 (25.2%) from children, and 7,732 (27.4%) from other non-service member beneficiaries including retirees and spouses, etc. (18 years or older) (data not shown).
The distribution of influenza (sub)types/lineages identified during the influenza season is shown in Table 1. Of the specimens tested, 5,529 (19.6%) were confirmed influenza positive. Among the 3,098 influenza A-positive specimens that were subtyped, 2,885 (93.1%) were influenza A(H1N1)pdm09, and 213 (6.9%) were influenza A(H3N2). A total of 2,336 specimens were characterized as influenza B positive. Of the influenza B with lineage information available, 856 (99.3%) belonged to the B/Victoria lineage, and 6 (0.7%) belonged to B/ Yamagata lineage. Moreover, 31 specimens tested positive for dual influenza infections. Among the 7,681 (27.3%) noninfluenza pathogens, 6,865 (89.4%) specimens were found to be positive for single noninfluenza respiratory pathogens, and 816 (10.6%) for noninfluenza pathogen coinfections (Table 1).
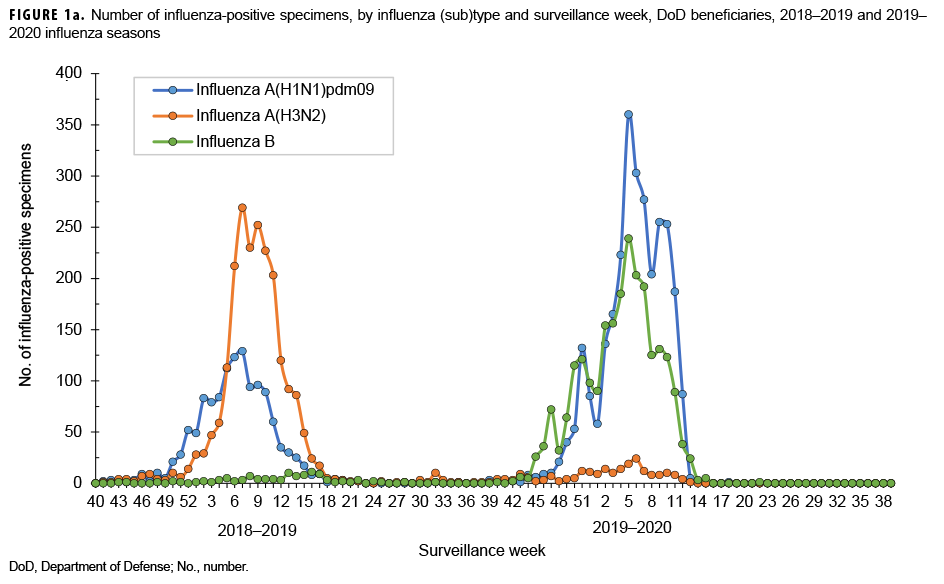
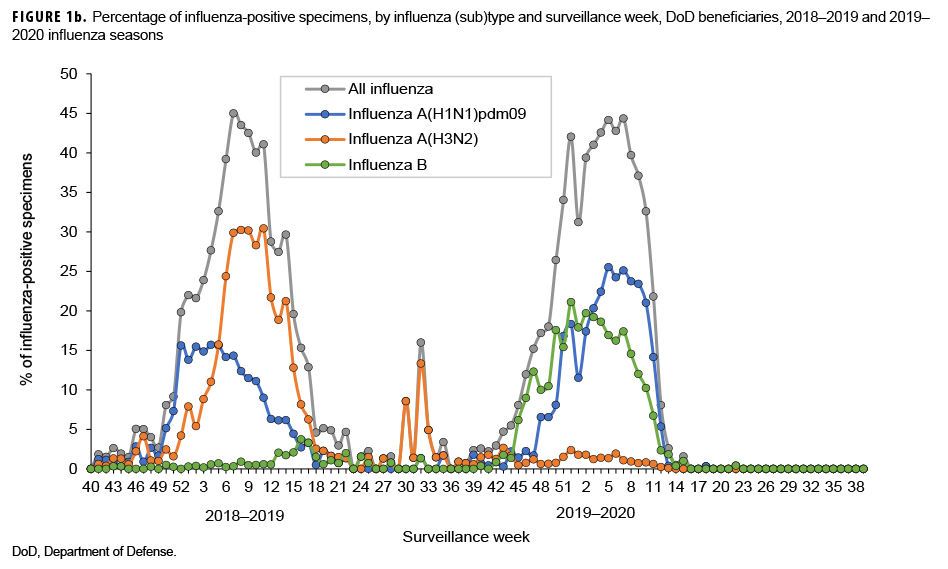
The numbers and percentages of influenza (sub)types that tested positive by week are presented in Figures 1a and 1b. Also, data from the 2018–2019 influenza season are provided to indicate seasonal influenza change from year to year. The influenza seasonal pattern generally revealed the influenza activity in the area of Northern Command from which the vast majority of specimens were collected. During the beginning of the influenza season (surveillance weeks 40–44; 29 Sept. to 2 Nov. 2019), low levels of influenza activity occurred, with small positivity rates of influenza A(H1N1) pdm09, influenza A(H3N2), and influenza B viruses (<3.0%; Figure 1b). However, starting from surveillance week 45 (3–9 Nov. 2019), influenza B was predominant. Three weeks thereafter, influenza A(H1N1)pdm09 activity increased quickly. From surveillance weeks 50 through 11 (8 Dec. 2019 to 14 March 2020), the activities of both influenza B and influenza A(H1N1)pdm09 remained highly elevated. The highest numbers of specimens that tested positive for both influenza B and A(H1N1)pdm09 occurred in surveillance week 7 (9–15 February 2020; Figure 1a). The results indicated peak influenza activity for the influenza season occurred from the end of Dec. 2019 through the end of Feb. 2020.
Genetic characteristics of influenza virus
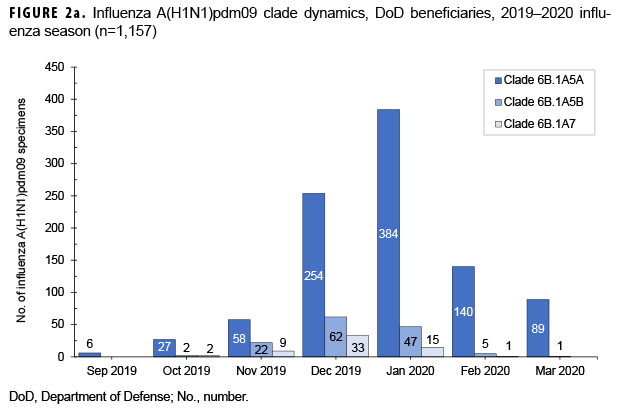
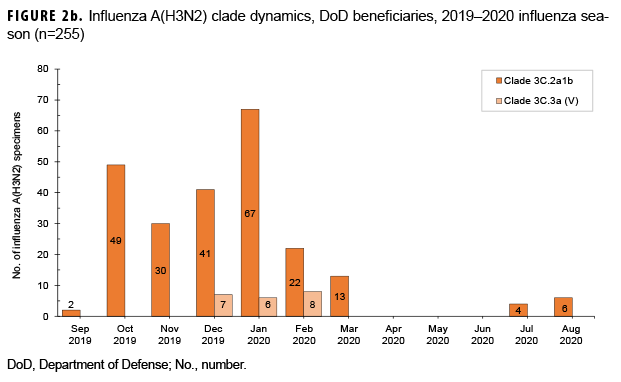
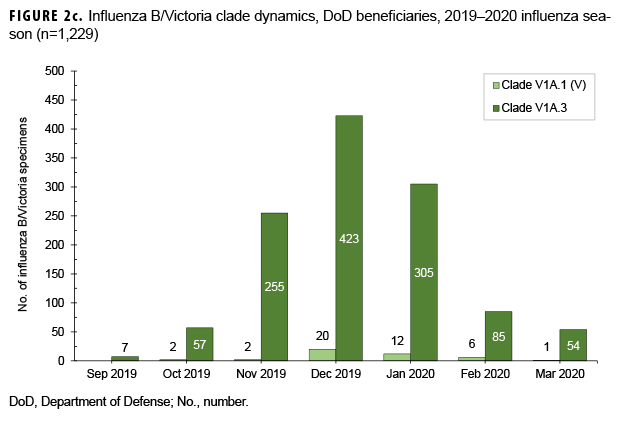
From 30 Sept. 2019 through 14 Aug. 2020, 2,652 influenza sequences were either generated at USAFSAM or contributed by partner laboratories at the Armed Forces Research Institute of Medical Sciences (AFRIMS), the Naval Medical Research Unit No. 2 (NAMRU-2), the Naval Health Research Center (NHRC), or the U.S. Army Medical Research Directorate-Kenya (USAMRD-K). In total, 1,157 (43.6%) influenza A(H1N1)pdm09, 255 (9.6%) influenza A(H3N2), 1,229 (46.3%) influenza B/Victori lineage (Figures 2a-2c), and 11 (0.4%) influenza B/Yamagata lineage hemagglutinin (HA) sequences were analyzed (data not shown).
All 1,157 of the influenza A(H1N1) pdm09 HA sequences were in clade 6B.1A (Figure 2a) and contained the substitution S183P relative to the vaccine strain, with 82.8% in subgroup 183P-5A, 12.0% in 183P-5B, and 5.2% in 183P-7 (data not shown). The average HA protein similarity of A(H1N1) pdm09 for the influenza season was 98.0% ± 0.38% (mean ± SD) compared with the 2019–2020 influenza vaccine A(H1N1)pdm09 component, A/Brisbane/02/2018-like virus (clade 6B.1A) (data not shown). Among the 255 influenza A(H3N2) HA sequences, 91.8% were in clade 3C.2a1b and 8.2% were in clade 3C.3a (Figure 2b). The average HA protein similarity of A(H3N2) for the influenza season was 96.5% ± 0.91% compared with the 2019–2020 influenza vaccine A(H3N2) component, A/Kansas/14/2017-like virus (clade 3C.3a) (data not shown). Among the 1,229 influenza B/Victoria HA sequences, 96.5% were in clade V1A.3 containing a three amino acid deletion at positions 162–164 and 3.5% were in clade V1A.1 containing a two amino acid deletion at positions 162–163 (Figure 2c). The average HA protein similarity of B/Victoria for the influenza season was 98.3% ± 0.24% compared with the 2019–2020 influenza vaccine B/Victoria component, B/Colorado/06/2017-like virus (clade V1A.1) (data not shown). All 11 of the influenza B/Yamagata HA sequences were in clade Y3 and had an average protein similarity for the influenza season of 99.1% ± 0.08% compared with the 2018–2019 influenza vaccine B/Yamagata component, B/Phuket/3073/2013-like virus (clade Y3), which was included in the quadrivalent vaccine only (data not shown).
Vaccine effectiveness
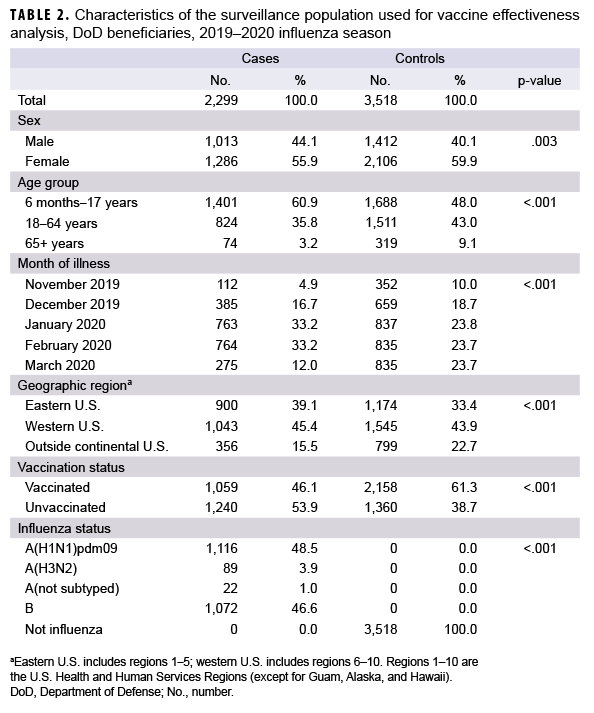
For the VE analysis, data were limited to surveillance weeks 46–12 (10 Nov. 2019 to 21 March 2020). There were 2,299 influenza-positive cases and 3,518 influenza-negative controls included in the VE analysis (Table 2). Of the influenza-positive cases, 46.1% had been vaccinated against influenza and 61.3% of the influenza-negative controls had been vaccinated. Influenza A and influenza B accounted for 53.4% and 46.6% of influenza-positive cases, respectively. Of the 1,227 outpatients infected with influenza A virus, only a small proportion (7.3%) were infected with influenza A(H3N2) virus (Table 2).
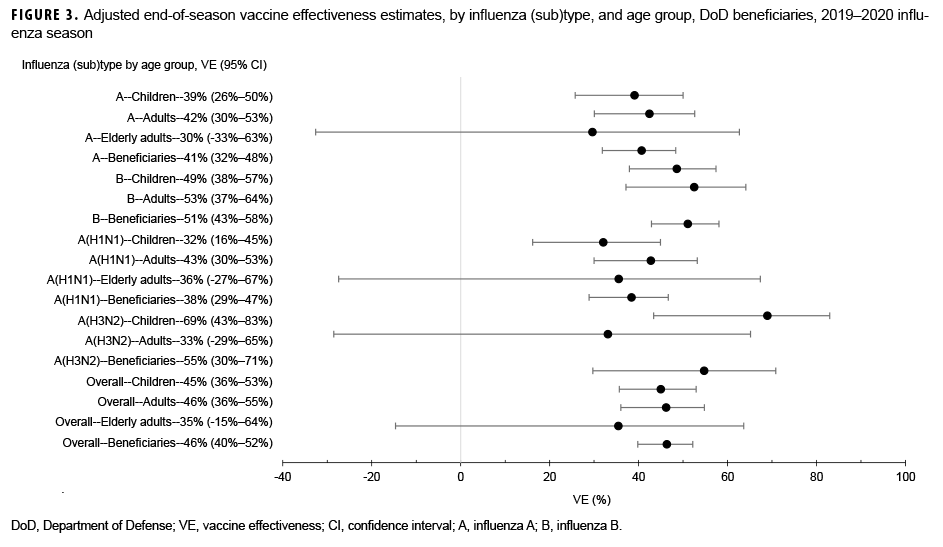
Among medically attended beneficiaries, adjusted VE against laboratory-confirmed influenza types was 46% (95% CI: 40%–52%) overall, including 38% (95% CI: 29%–47%) against influenza A(H1N1)pdm09, 55% (95% CI: 30%–71%) against influenza A(H3N2), and 51% (95% CI: 43%–58%) against influenza B (Figure 3). In addition, VE was estimated against any influenza viruses by age group. For children, the adjusted VE was 45% (95% CI: 36%–53%) against all influenza viruses, including 32% (95% CI: 16%–45%) against influenza A(H1N1)pdm09, 69% (95% CI: 43%–83%) against influenza A(H3N2), and 49% (95% CI: 38%–57%) against influenza B. In contrast, the adjusted VE for adults (18–64 years of age) was 46% (95% CI: 36%–55%) against any influenza viruses, including 43% (95% CI: 30%–53%) against influenza A(H1N1)pdm09, 33% (95% CI:-29%–65%) against influenza A(H3N2), and 53% (37%–64%) against influenza B. For elderly adults (≥65 years of age), none of the estimates of VE against any influenza viruses were statistically significant (Figure 3).
Editorial Comment
During the 2018–2019 influenza season, influenza B activity was low; however, for the 2019–2020 influenza season, influenza B made an early appearance and predominated at the start of the season, then maintained high activity until the end of March 2020. Influenza A(H1N1)pdm09 was active during the 2018–2019 influenza season, but its activity was higher during the 2019–2020 influenza season. In contrast to relatively high influenza A(H1N1)pdm09 activity during the 2019–2020 influenza seasons, influenza A(H3N2) was the dominant influenza A subtype circulating during the 2018–2019 season, but its activity was very low during the 2019–2020 influenza season. Overall, the magnitude of the influenza positivity rate during the 2019–2020 influenza season was similar to that during the 2018–2019 influenza season, with a peak influenza positivity among ILI-related specimens of 44%.
During the 2019–2020 influenza season, multiple genetic clades circulated for influenza A(H1N1)pdm09, A(H3N2), and B/Victoria. For these 3 (sub)types, the predominantly circulating genetic clades differed from the strain composition of the 2019–2020 influenza vaccine, with data suggesting that these clades are antigenically distinct with reduced inhibition by the vaccine.6 Influenza viruses from these predominating clades were selected for the 2020–2021 influenza vaccine recommendations,6 and there are no indications in the current data to suggest significant genetic changes in the circulating strains from the vaccine selections.
For the 2018–2019 influenza season, DODGRS reported that adjusted VE against any influenza in the DOD beneficiary population was lower (30%; 95% CI: 22%–38%) than for the 2019–2020 influenza season.1 Similarly, a lower VE (29%; 95% CI: 21%–35%) was found among participants during the 2018–2019 season using U.S. Influenza Vaccine Effectiveness Network data.7 The decreased VE was associated with the spread of antigenically drifted influenza A(H3N2) viruses during the 2018–2019 season.7 However, for the 2019–2020 influenza season, the estimated VE against all influenza based on DOD beneficiaries regardless of age group was higher (46%; 95% CI: 40%–52%) than the VE for the previous season. This finding is consistent with the interim VE estimate (45%; 95% CI: 36%–53%) against any influenza virus obtained using data from 4,112 children and adults enrolled in the U.S. Influenza Vaccine Effectiveness Network during 23 Oct. 2019–25 Jan. 2020.8 The end-of-season VE estimates from the current analysis suggested that the 2019–2020 season's influenza vaccine was moderately effective against influenza viruses.
VE estimates were adjusted using potential confounders (e.g., age group, specimen collection date, geographical region) as covariates in multiple logistic regression models. However, due to the lack of randomization, inherent in any observational study, it is difficult to rule out unmeasured confounding factors (e.g., vaccination history) as a possible alternative explanation for the findings. In addition, the efforts to estimate the effect of vaccination rely on the DOD surveillance platform for data acquisition. The findings in the current study might be subject to limitations during the DOD surveillance data collection process. One important limitation is potential non-differential misclassification of vaccination status due to poor recall or record errors on the self-reported questionnaire.9 Furthermore, it should be noted that VE was estimated from data across geographically disparate areas. Although effort was made to statistically adjust for the potential confounding effect of geographical region, there may still be residual heterogeneity across geographical regions that was not accounted for, which would potentially impact the estimation of VE.
The overall outpatient population was relatively large for estimating VE. However, when outpatients were stratified based on age group and influenza virus sub(type) or lineage, VE in certain subgroups of interest could not be accurately estimated or even at all. For instance, in the current study, it was not possible to estimate VE against influenza A(H3N2) in the elderly. To improve the statistical power of tests, further study is warranted to accurately estimate VE, by combining DODGRS surveillance data over multiple influenza seasons using generalized linear mixed modeling. Indeed, the measurement of influenza VE can be affected by many factors such as age and health of influenza vaccine recipients, (sub) type/lineage of circulating viruses, as well as the study methodology used.10 Combining data from multiple influenza seasons may permit influenza VE analysis of relationships between VE and several viral and host factors.
Author Affiliations: Author affiliations: Defense Health Agency/Armed Forces Health Surveillance Division-Air Force Satellite–U.S. Air Force School of Aerospace Medicine, Wright-Patterson Air Force Base, OH (Dr. Hu, Mr. Kwaah, Ms. DeMarcus, Mr. Thervil, Dr. Sjoberg, Lt Col Robbins); JYG Innovations, LLC, Dayton, OH (Dr. Hu, Mr. Kwaah, Mr. Gruner, Ms. DeMarcus, Mr. Thervil, Dr. Sjoberg); U.S. Air Force School of Aerospace Medicine epidemiology laboratory, Wright-Patterson Air Force Base, OH (Mr. Gruner, Dr. Fries).
Acknowledgements: The authors would like to thank the Department of Defense Global Respiratory Pathogen Surveillance Program and its sentinel partners, and the U.S. Air Force School of Aerospace Medicine epidemiology laboratory for their valuable contributions to this work.
References
- Kersellius GD, Gruner WE, Fries AC, DeMarcus LS, Robbins AS. Respiratory pathogen surveillance trends and influenza vaccine effectiveness estimates for the 2018-2019 season among Department of Defense beneficiaries. MSMR. 2020;27(1):17–23.
- DeMarcus L, Shoubaki L, Federinko S. Comparing influenza vaccine effectiveness between cell-derived and egg-derived vaccines, 2017–2018 influenza season. Vaccine. 2019;37:4015–4021.
- Shepard SS, Meno S, Bahl J, Wilson MM, Barnes J, Neuhaus E. Viral deep sequencing needs an adaptive approach: IRMA, the iterative refinement meta-assembler. BMC Genomics. 2016;17:708.
- Hall TA. BioEdit: a user-friendly biological sequence alignment editor and analysis program for Windows 95/98/NT. Nucl Acids Symp Ser. 1999;41:95–98.
- DNASTAR: Lasergene Core Suite (RRID:SCR_000291).
- World Health Organization. Recommended composition of influenza virus vaccines for use in the 2020-2021 northern hemisphere influenza season. Accessed 29 December 2020. https://www. who.int/influenza/vaccines/virus/recommendations/ 202002_recommendation.pdf
- Flannery B, Garten Kondor RJ, Chung JR, et al. Spread of antigenically drifted influenza A(H3N2) viruses and vaccine effectiveness in the United States during the 2018v2019 season. J Infect Dis. 2020;221:8–15.
- Dawood FS, Chung JR, Kim SS, et al. Interim estimates of 2019-20 seasonal influenza vaccine effectiveness–United States, February 2020. MMWR Morb Mortal Wkly Rep. 2020;69:177–182.
- Lynch LC, Coleman R, DeMarcus L, et al. Department of Defense midseason estimates of vaccine effectiveness for the 2018-2019 influenza season. MSMR. 2019;26(7):24–27.
- Centers for Disease Control and Prevention. How flu vaccine effectiveness and efficacy is measured: questions and answers. Accessed 29 December 2020. https://www.cdc.gov/flu/vaccineswork/ effectivenessqa.htm