From July 2022 through June 2023, a total of 423 members of the active (n=376) and reserve (n=47) components of the U.S. Armed Forces had at least one cold weather injury. The crude overall incidence rate of cold injury among all active component service members during the 2022-2023 cold season was 28.5 per 100,000 person-years (p-yrs), 15.2% lower than the rate observed during the 2021-2022 cold season (33.6 per 100,000 p-yrs). The rates of cold injuries varied among the Armed Forces, with the highest rates per 100,000 p-yrs observed in the Army, at 50.9, followed by the Marine Corps, at 32.2, the Air Force, at 18.9, the Navy, at 8.1, and the Coast Guard at 5.1. Consistent with previous cold seasons, frostbite (54.0%) remained the most common type of cold injury among ACSM during the 2022-2023 cold season, while the proportions of hypothermia and immersion injuries were 16.5% and 30.3%, respectively. Cold injury rates among ACSM during the 2018 to 2023 cold seasons were generally highest for males, non-Hispanic Blacks, those under 20 years of age, and enlisted members. The number of cold injuries identified in service members deployed outside the U.S during the 2022-2023 cold season (n=10) was comparable to the two preceding cold seasons (11 in 2020-2021 and 12 in 2021-2022), with frostbite accounting for half (n=5) of the 2022-2023 cases.
What are the new findings?
For all ACSM, the rate of cold weather injuries in 2022-2023 decreased by 15.2% compared to the preceding cold season. The decrease was most pronounced in the Marine Corps, with a 22.0% reduction in the incidence rate of cold injuries. This year’s report includes cold injury rates for the Coast Guard.
What is the impact on readiness and force health protection?
Cold injuries are a predictable and preventable threat. Continuous surveillance is essential to prevent cold weather injuries and mitigate their adverse impacts on military operations. Military training and combat operations require continued emphasis on effective cold weather injury prevention strategies and adherence to relevant policies and procedures to protect service members against such injuries.
Background
Cold injuries are of significant military concern because of their adverse impact on operations and the high financial costs of treatment and disability.1,2 In response, the U.S. Armed Forces have developed and are continually improving their training, doctrine, procedures, and protective equipment and clothing to counter the threat of cold environments.3-8 Although these measures are highly effective, cold injuries continue to affect hundreds of service members each year due to exposure to both cold and wet environments.9
Military training or mission requirements in cold and wet weather conditions can preclude immediate warm or dry shelter, the ability to change wet or damp clothing, or even healthy physical activity.2-4 Continuous surveillance of cold weather injuries is essential to inform measures for reducing their impacts and remind leaders of this predictable threat. The Department of Defense guidelines for reportable medical events require reporting of cases of hypothermia, freezing peripheral injuries (e.g., frostbite), and non-freezing peripheral injuries (e.g., immersion injuries, chilblains).10
Cold injuries can be broadly categorized in two major groups: those with a central effect, and those primarily affecting peripheral parts of the body. Hypothermia is a classic example of a central cold injury, which occurs when the body’s core temperature falls below 95°F.7 Freezing atmospheric temperatures are not required to produce hypothermia.11 Severe hypothermia can lead to pulmonary edema, reduced heart rate, coma, ventricular arrhythmias (including ventricular fibrillation), and asystole.11-13
Peripheral cold injuries mainly affect extremities such as hands and feet, and can be further classified as either freezing injuries, such as frostbite, or non-freezing injuries such as immersion foot. Freezing peripheral injury is defined as the damage sustained by tissues exposed to temperatures below freezing.14 A substantial proportion of patients with peripheral frostbite experience permanent changes in their microcirculation and disruption of local neurological functions (e.g., reduced sensation in the affected area).15 The areas of the body most frequently affected by frostbite include the ears, nose, cheeks, chin, fingers, and toes.15,16 Although most frostbite damage is minor, severe injury may lead to impaired functioning and inability to work due to cold hypersensitivity, chronic ulceration, vasospasm, localized osteoarthritis, or chronic pain.15,17
Non-freezing peripheral cold injury includes a spectrum of localized injuries to the soft tissues, nerves, and vasculature of distal extremities that result from prolonged exposure (12 to 48 hours) to wet, cold (generally 32 to 59°F) conditions; the injury process is generally slower in warmer water.14,21 Although non-freezing peripheral cold injuries most often involve feet (e.g., immersion foot), any dependent body part can be affected by the condition, including the hands.22 Immersion foot generally presents as waterlogging, with the most marked effect in the soles20,21: The foot becomes hyperemic (i.e., increased blood flow), painful, and swollen with continuous exposure; progression to blistering, decreased blood flow, ulceration, and gangrene is gradual.20,21 Long-term complications of non-freezing cold injury such as immersion foot are similar to, and equally debilitating as, those produced by frostbite: hypersensitivity to cold, chronic pain, and severe pain induced by walking.17,19,20,21
Environmental factors that increase the risk of cold weather injuries include prolonged outdoor exposure to temperatures 40°F and below, wind speeds exceeding five miles per hour, high altitude, hypoxia, geographic location, wet conditions due to rain and snow, or submersion in cold water, in addition to lack of adequate shelter and clothing.22 Situational factors that increase risk of immersion foot include immobility, wet socks, and constrictive boots.20,23,24 Individual risk factors vary and include previous cold injury, exhaustion, dehydration, fatigue, sleep deprivation, improper acclimatization, inadequate nutrition, alcohol use, smoking, chronic disease (e.g., peripheral vascular disease, diabetes), older age, and medications that impair compensatory responses (e.g., oral antihyperglycemics, beta-blockers, general anesthetic agents).13-17,20
Since 2004, the MSMR has published annual updates on the incidence of cold weather injuries affecting U.S. military members for the 5 most recent cold seasons.25 The timing of these annual updates is intended to call attention to the recurring risks of such injuries as winter approaches in the Northern Hemisphere, where most members of the U.S. Armed Forces are assigned. This 2023 report addresses the occurrence of frostbite, immersion hand and foot, and hypothermia during the cold seasons from July 2018 through June 2023. Cases of chilblains are not included in this report because the condition is common, infrequently diagnosed, usually mild in severity, and thought to have minimal medical, public health, or military impacts.
Methods
This surveillance population included all individuals who served in the active or reserve components of the U.S. Armed Forces at any time during the surveillance period of July 1, 2018 through June 30, 2023. Service members in the Space Force were classified as Air Force for this analysis due to data availability beginning January 2023 for the newly formed service. For analysis purposes, “cold years” or “cold seasons” were defined as July 1 through June 30 intervals so complete cold weather seasons could be represented in annual summaries and comparisons.
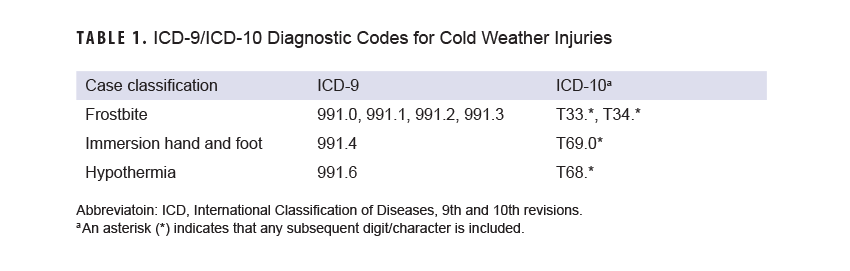
Records of cold weather injuries for frostbite, immersion hand and foot, and hypothermia were queried from RMEs submitted to the Disease Reporting System internet and diagnostic codes from inpatient and outpatient medical encounters and records from the Theater Medical Data Store. Data from these sources are routinely incorporated into the Defense Medical Surveillance System. A case was defined by the presence of an RME or one of any qualifying International Classification of Diseases, 9th or 10th revision (ICD-9 and ICD-10, respectively) code in the first diagnostic position of a record of a health care encounter (Table 1).
Due to an update to the DRSi medical event reporting system in July 2017, the type of RME for a cold injury (e.g., frostbite, immersion injury, hypothermia) could not be distinguished using RME records in DMSS data. Instead, information on the types of RMEs for cold injury between July 2018 and June 2023 were extracted from DRSi and then combined with DMSS data.
To estimate the number of unique individuals who suffered a cold injury each cold season, and to avoid counting follow-up health care encounters, only one cold injury per individual per cold season was included. To count types of cold injury, namely frostbite, immersion hand and foot, and hypothermia cases, one of each type of cold injury per individual per cold season could be included. For example, if an individual was diagnosed or reported with immersion hand and foot at one point during a cold season and then with frostbite later in the same cold season, each of those different types of injury would be included in the injury calculation. If a service member had multiple medical encounters for cold injuries on the same day, only one encounter was used for analysis (hospitalizations were prioritized over ambulatory visits, which were prioritized over RMEs).
Annual incidence rates of cold injuries among active component service members were calculated as incident cold injury diagnoses per 100,000 person-years of service. Annual rates of cold injuries among reservists were calculated as cases per 100,000 persons using the total number of reserve component service members for each year of the surveillance period. Counts of persons in the reserves were used as the denominator in these calculations because information on the start and end dates of active duty service periods of reserve component members is not available.
Cold injuries are summarized by the locations where service members were treated for those injuries, identified by a Defense Medical Information System Identifier of an encounter. Because such injuries can occur during field training, temporary duty, or outside usual duty stations, DMIS ID was used as a proxy for the location where the cold injury occurred.
Results
2022–2023 cold season
From July 2022 through June 2023, a total of 423 members of the active (n=376) and reserve (n=47) components had at least one cold weather injury (Table 2).
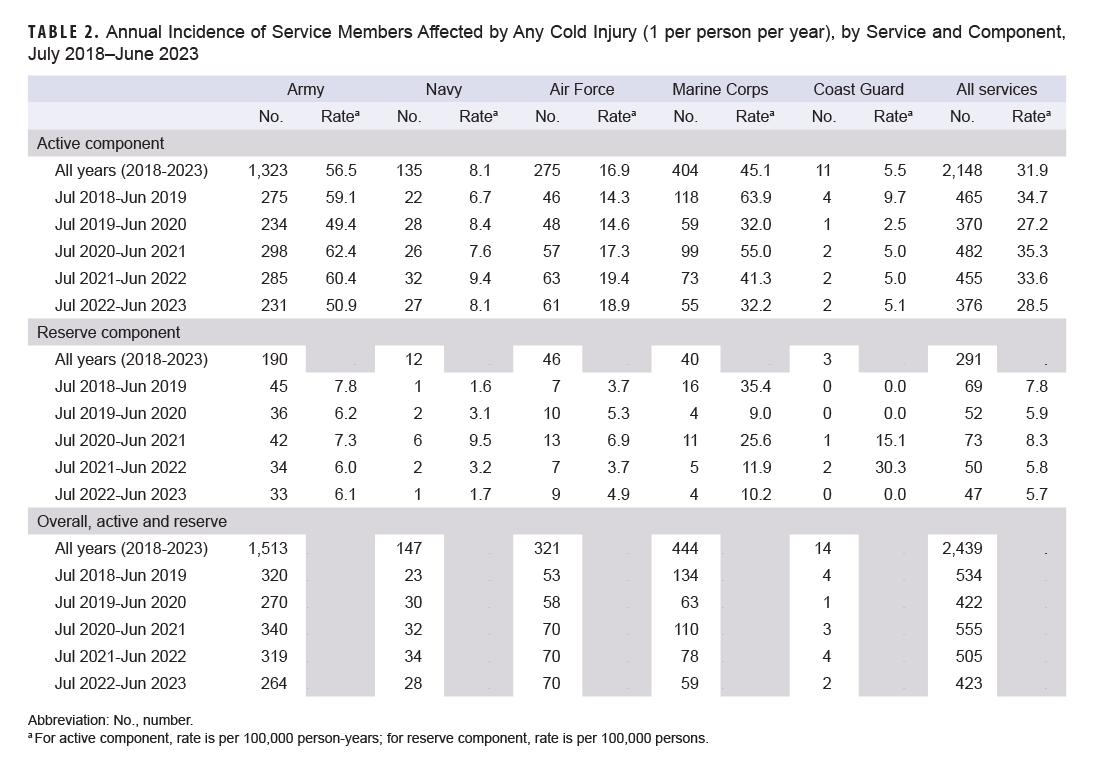
In the active component, Army members had the highest rate of any cold injury (n=231, 50.9 per 100,000 p-yrs) during the 2022-2023 cold season, followed by members of the Marine Corps (n=55, 32.2 per 100,000 p-yrs), Air Force (n=61, 18.9 per 100,000 p-yrs), and Navy (n=27, 8.1 per 100,000 p-yrs). Only two active component Coast Guard members were affected by cold weather injuries during the 2022-2023 cold season (5.1 per 100,000 p-yrs). One cold injury, frostbite, was recorded for a member of the Space Force (counted with the Air Force) (data not shown). Among the reserve component, Army personnel accounted for more than two-thirds of cases (n=33, 6.1 per 100,000 p-yrs) during 2022-2023 (Table 2), although the Marine Corps had the highest rate of cold injuries among reservists (n=4, 10.2 per 100,000 persons).
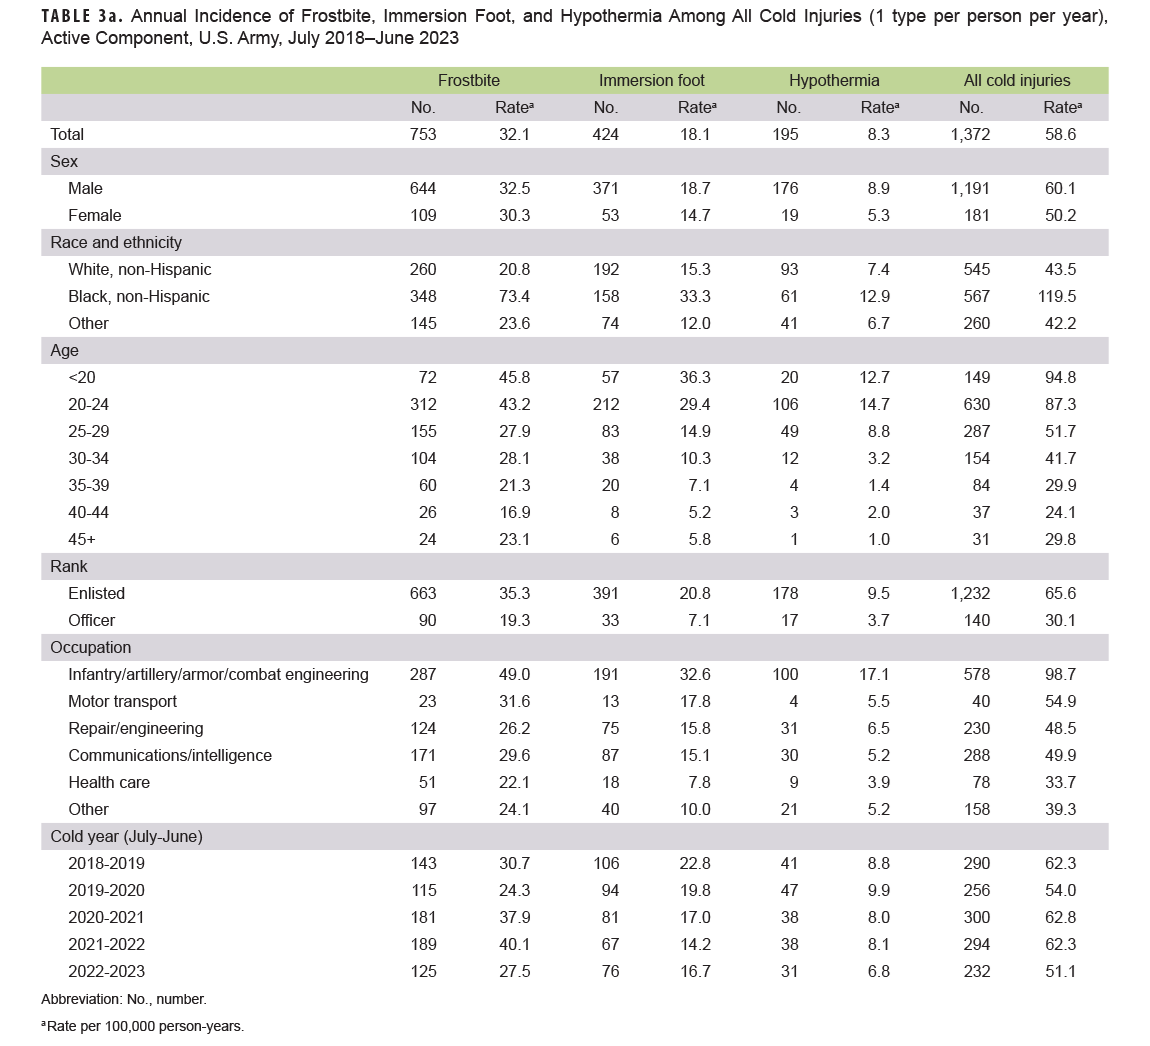
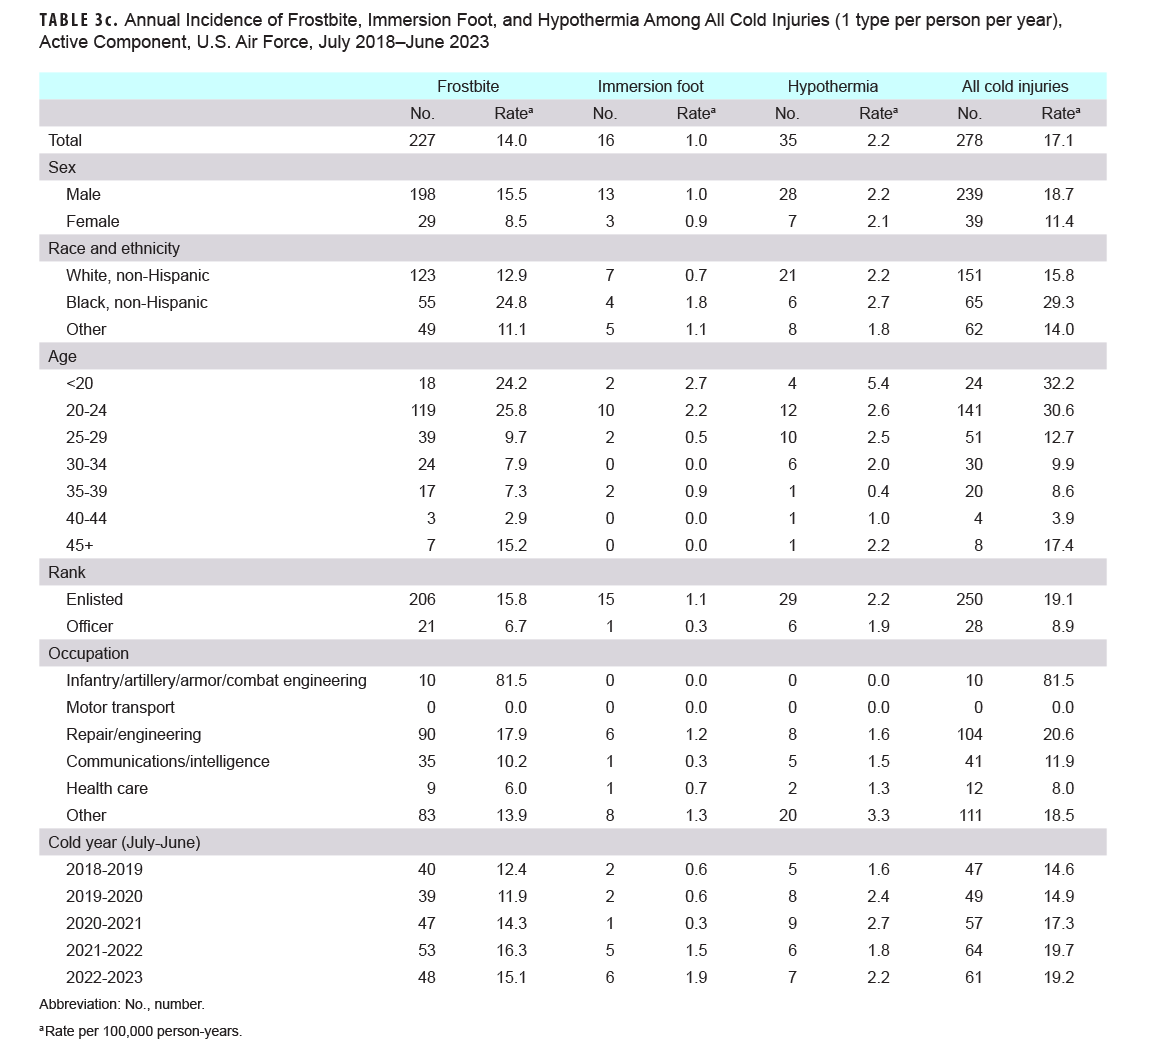
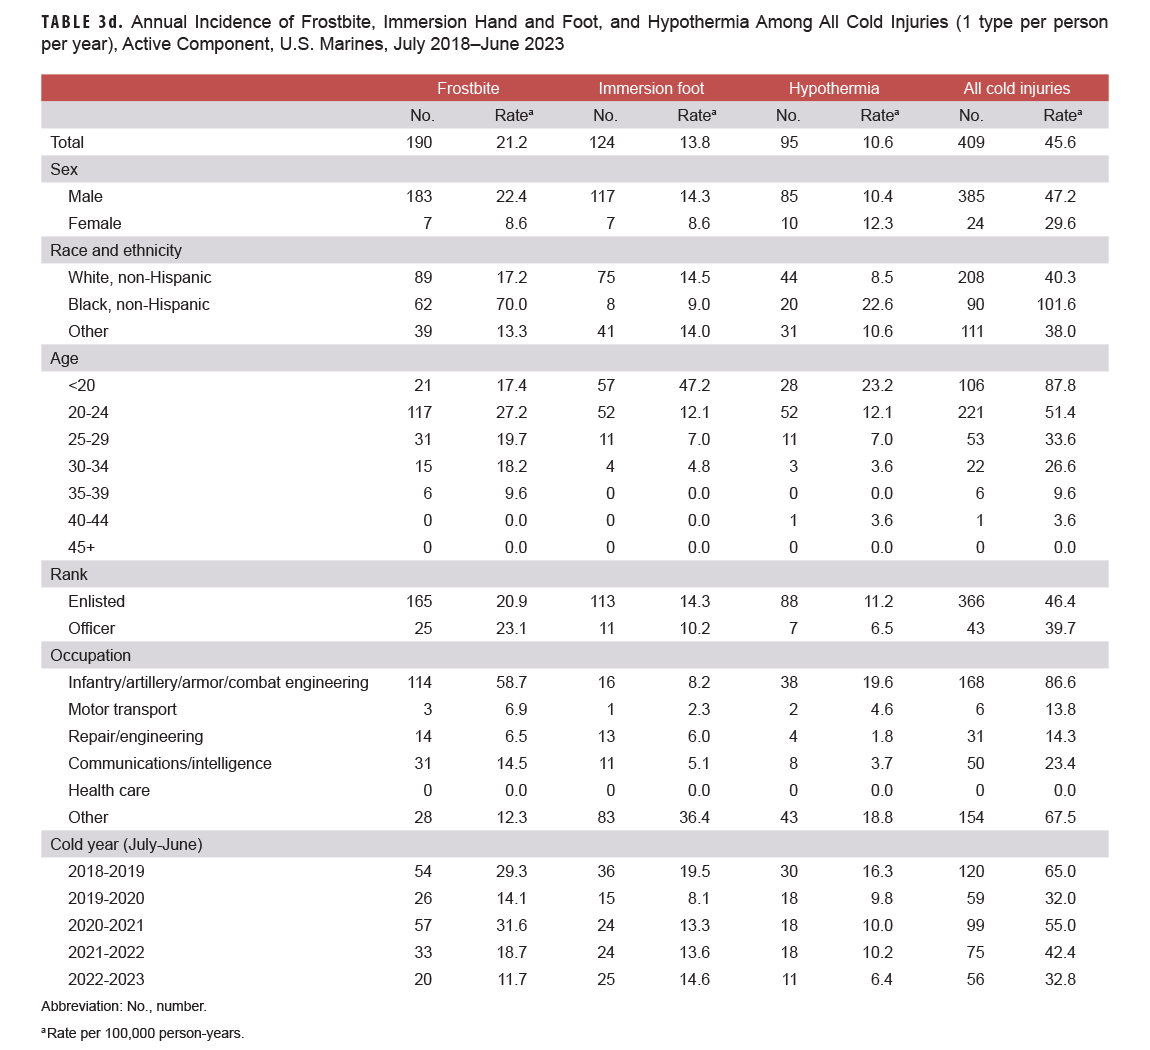
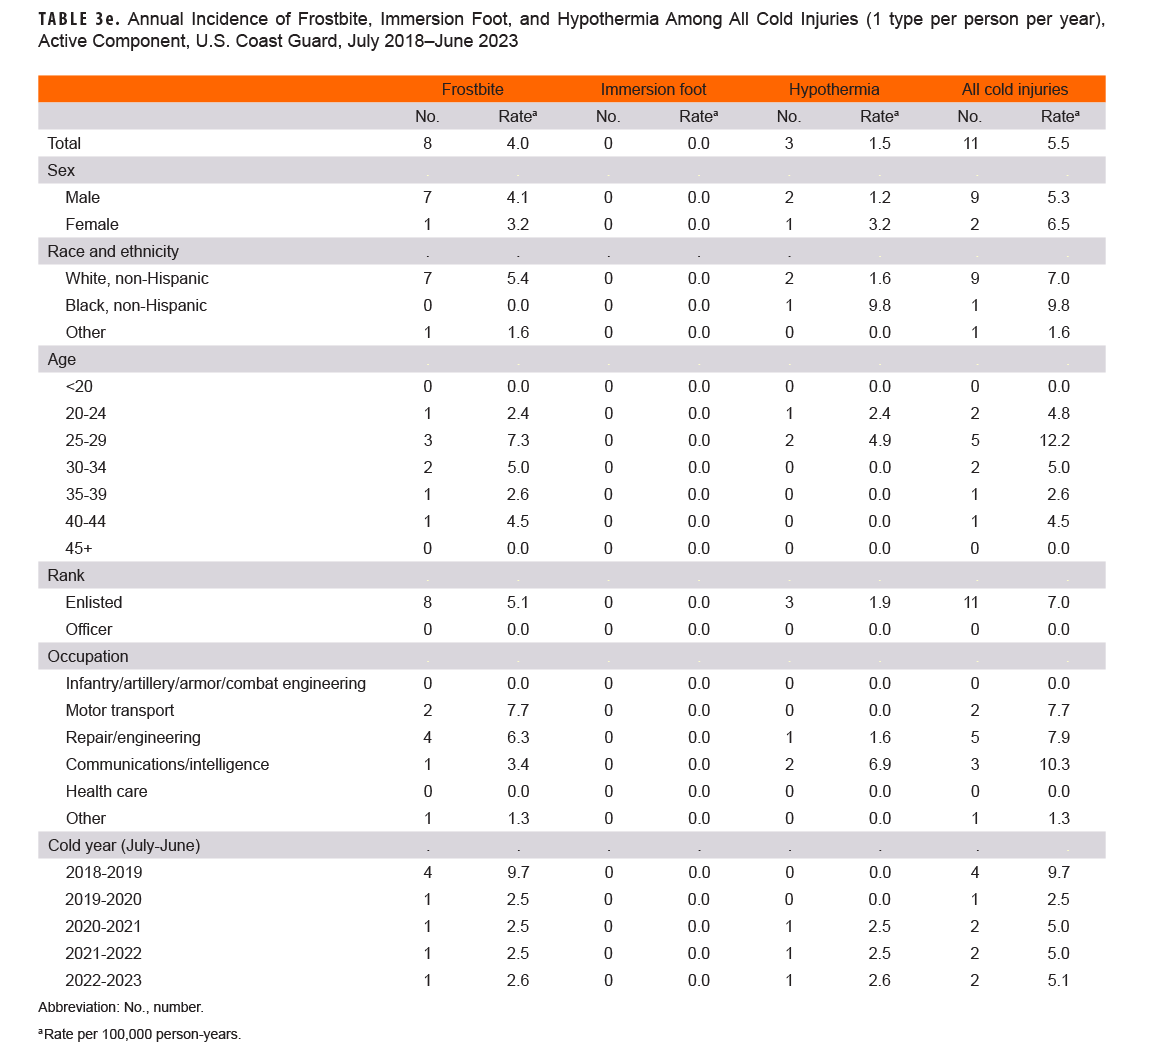
When major types of cold injury case classifications are considered (not numbers of individuals affected), frostbite was the most common type of cold injury (n=202; 54.0% of all cold injuries) among ACSM in all services in 2022-2023 (Tables 3a–3e). Within the Air Force during the 2022-2023 season, 78.7% of all cold injuries were frostbite, but the proportions of frostbite injury in the Army (53.9%), Marine Corps (35.7%) and Navy (29.6%) were much lower. The Coast Guard had two cold weather injuries in 2022-2023, one each of frostbite and hypothermia.
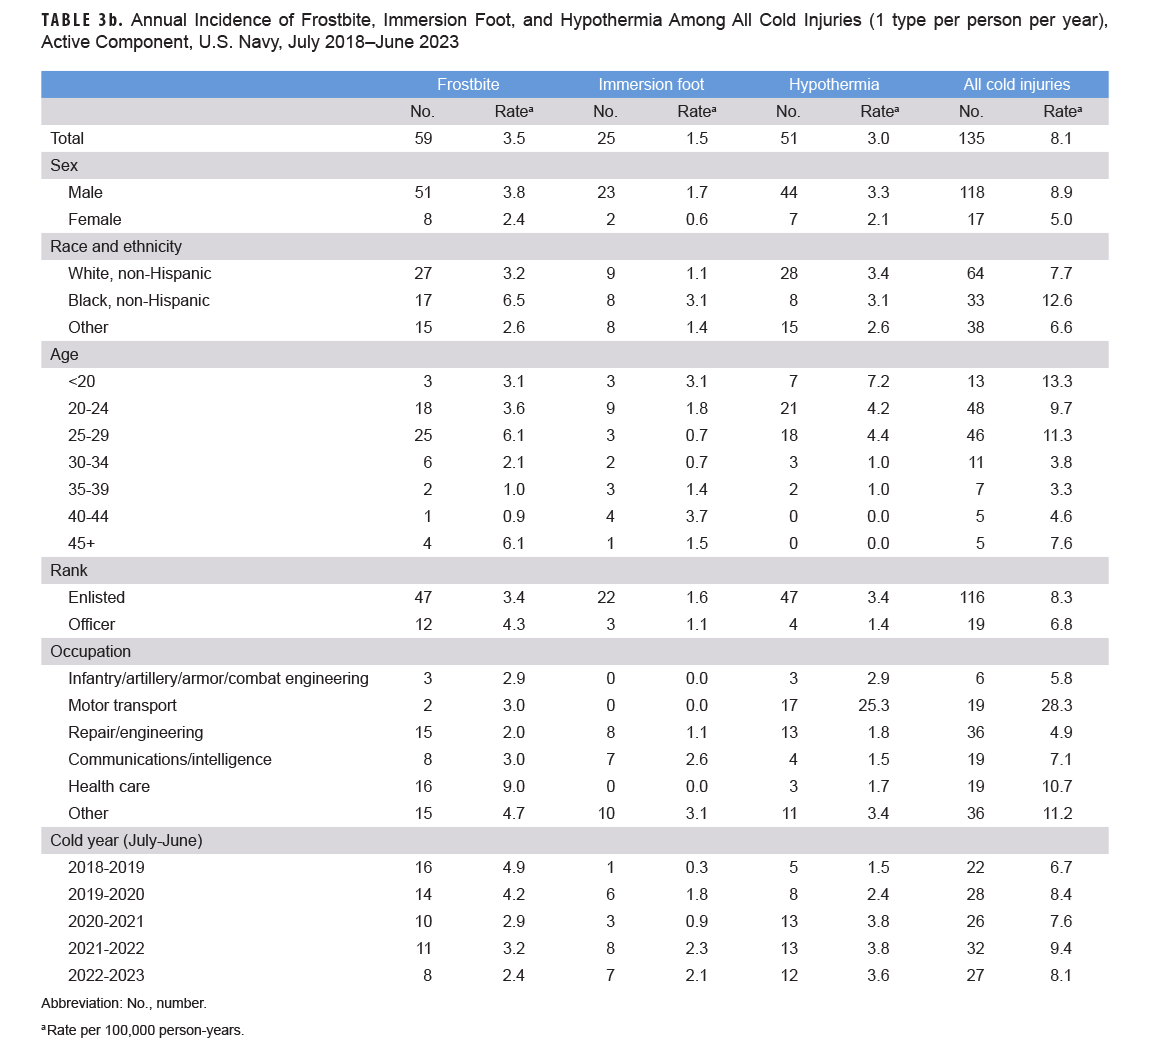
For all active component service members in 2022-2023, the proportions of hypothermia (n=62) and immersion injuries (n=114) were 16.5% and 30.3%, respectively (Tables 3a–3e). The numbers and rates of hypothermia injuries in the 2022-2023 cold season were the lowest among active component Army and Marine Corps members during the 5-year period, while case counts and rates of frostbite were the lowest among active component Navy members (Table 3a, Table 3b, Table 3d).
Five cold seasons: July 2018–June 2023
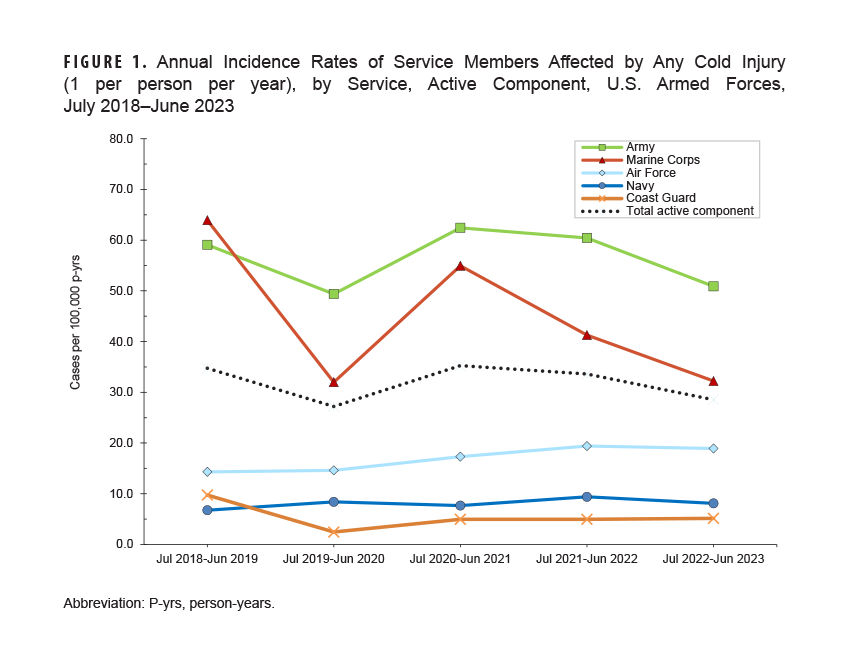
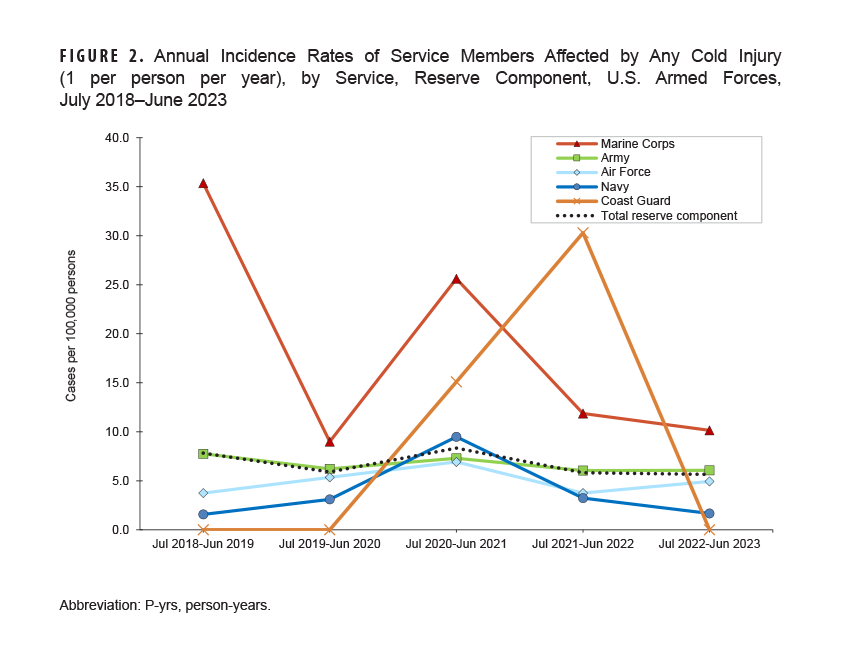
The crude overall incidence rate of cold injury for all ACSM in 2022-2023 was 28.5 per 100,000 p-yrs, representing a 15.2% decline compared to the rate observed in 2021-2022 (33.6 per 100,000 p-yrs) (Table 2, Figure 1). Throughout the surveillance period, cold injury rates were consistently higher among active component members of the Army and the Marine Corps (Figure 1). The active component service-specific incidence rates decreased the most from 2021-2022 to 2022-2023 among Marine Corps members, by 22.0%, followed by the Army, with a 15.8% decrease, while the Navy reported a 13.6% decrease, and the Air Force rate decreased 2.5%. Incidence rates of cold injuries for the last two cold seasons were similar for the Coast Guard (5.1 per 100,000 p-yrs in 2022-2023, 5.0 in 2021-2022). Crude overall incidence rates of cold injuries were also similar for reserve component service members (5.7 per 100,000 p-yrs in 2022-2023 and 5.8 per 100,000 p-yrs in 2021-2022) for the past two seasons (Figure 2).
During the 5-year surveillance period, overall rates of cold injuries were generally higher among males in all services except the Coast Guard (Tables 3a–3e). The overall rates among male service members of the Navy, Air Force, and Marine Corps were 1.6 to 1.8 times higher than those of their female counterparts.
For all services, overall rates of cold injuries were higher among non-Hispanic Black service members than those of the other races and ethnicities (Tables 3a–3e). Rates of frostbite among non-Hispanic Black members of the Army were more than three times higher than those of other races and ethnicities, with the biggest differences observed in the Marine Corps—where it was more than four times higher.
Rates of cold injuries in all services were highest among the youngest service members and tended to decrease with increasing age (Tables 3a–3e).
Enlisted members of all five services experienced higher rates of injury than officers. Rates of all cold injuries in the Army, Air Force, and Marine Corps combined were highest among service members in combat-specific (infantry/artillery/combat or engineering/armor) occupations (Tables 3a, 3c–3d). Among the active component of the Navy, rates of cold injuries during the 5-year surveillance period were highest for service members in motor transport occupations (Table 3b).
Among the cold injury cases reported within the active component during the 5-year period (n=2,137), 89 (4.2% of the total) occurred during basic training. The Army (n=36) and Marine Corps (n=51) accounted for 97.8% of all basic trainees affected by cold injuries (data not shown). Throughout the course of the 5-year surveillance period, a total of 46 service members were hospitalized, a figure which represents 2.2% of total cold weather injuries for the period: Army (n=32) and Marine Corps (n=9) members accounted for most (89.1%) of all hospitalized cases (data not shown).
Cold injuries during deployments
During the 5-year surveillance period a total of 66 cold injuries were diagnosed among service members deployed outside the U.S. (data not shown), of which 35 (53.0%) were frostbite, 20 (30.3%) were immersion injuries, and 11 (16.7%) were hypothermia. Approximately one-third (n=23) of all 66 deployment-associated cold injuries were diagnosed during the 2018-2019 cold season. The number of cases in subsequent cold seasons were consistent, with 10 to 12 cold injuries recorded each season (data not shown). Frostbite injuries accounted for half (n=5; 50.0%) of cold weather injuries identified in service members deployed outside of the U.S during the 2022-2023 cold season.
Cold injuries by location
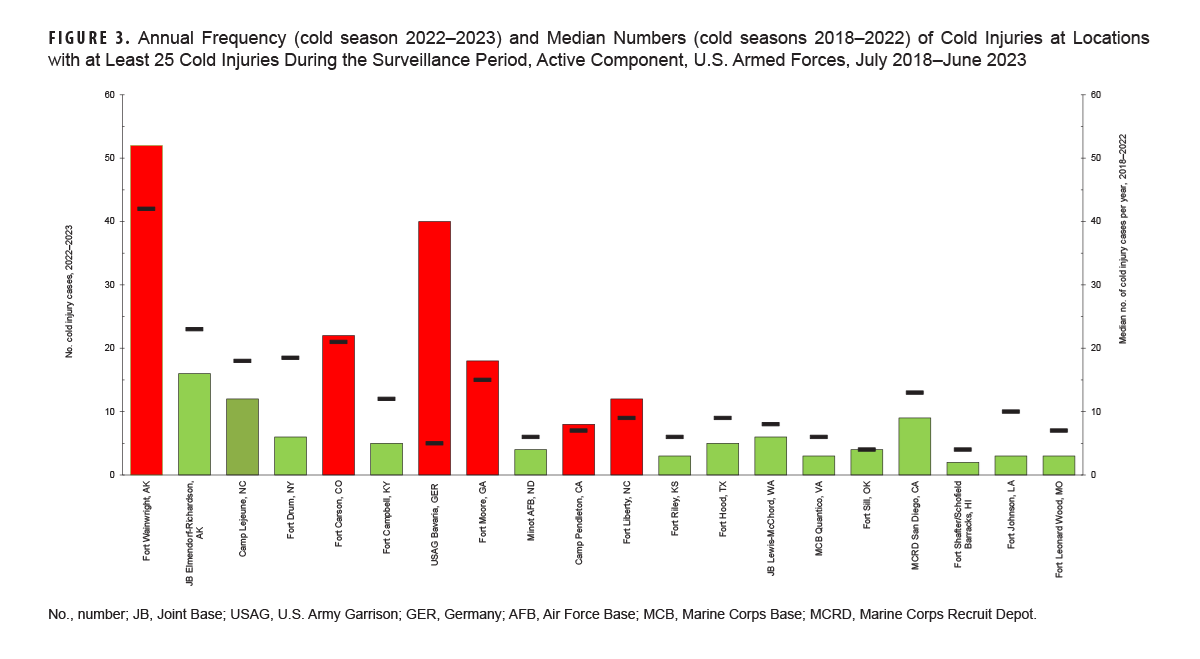
During the 5-year period, 20 military locations reported at least 25 incident cold injuries (one per person per year) among ACSM (Figure 3). Locations with the highest 5-year counts of incident injuries were Fort Wainwright (n=236), Joint Base Elmendorf-Richardson (n=167), Fort Carson (n=96), Camp Lejeune (n=93), Fort Moore (formerly Benning) (n=79), Fort Drum (n=71), and Fort Campbell (n=71) (data not shown). During the 2022-2023 cold season, incidence rates of cold injuries were higher than the 2021-2022 incidence rates at 6 of the 20 locations (data not shown). The most notable increase was at the Army’s Fort Carson, where 22 cases (98.2 per 100,000 p-yrs) were identified in 2022-2023, compared to 11 (42.1 per 100,000 p-yrs) the prior year (data not shown). U.S. Army Garrison Bavaria's case count increased the most, from 1 in 2021-2022 to 40 in 2022-2023. Figure 3 charts the 2022-2023 seasonal numbers of cold injuries and median case numbers for the prior four seasons for the 20 locations with at least 25 cases. At 16 installations, case numbers in 2022-2023 were less than the median counts for the previous four years.
Discussion
The overall rate of cold weather injuries among ACSM in 2022-2023 decreased by 15.2% from the previous cold injury season. This decrease was most pronounced within the Marine Corps, with a 22.0% lower incidence rate from 2021-2022. As in prior years, cold injury rates were much higher among members of the Army and Marine Corps. In 2022-2023, frostbite was the most common type of cold injury among ACSM in all five services.
Compared to their respective counterparts, overall rates of cold injuries were higher among male service members, non-Hispanic Black service members, the youngest (less than 20 years old), and enlisted service members. Rates of frostbite were markedly higher among non-Hispanic Blacks compared to non-Hispanic Whites and those in the other/unknown race and ethnicity group. These differences have been noted in prior MSMR updates, and results of several studies suggest that other factors (e.g., physiological differences, previous cold weather experience) are possible explanations for increased susceptibility.9,15,26–28
It should be noted that this analysis of cold injuries was unable to distinguish between injuries sustained during official military duties (training or operations) and those associated with unrelated or personal activities. RMEs for non-freezing peripheral injuries were excluded if “chilblains” was listed in case comments; some RMEs for chilblains were potentially misclassified, however, as immersion injury if chilblains were not listed in the case comments.
To prepare for all circumstances posing a threat for cold weather injury, service members should be aware of and able to identify signs of cold injury, as well as environmental, individual and situational risk factors, and protective measures for themselves and fellow service members, whether during training, operations, combat, or recreation in wet or freezing conditions.
This article has been revised due to an error in the original published version.
References
- Candler WH, Freedman MS. Military medical operations in cold environments. In: Pandolf KB, Burr RE, eds. Medical Aspects of Harsh Environments, Volume 1. Office of the Surgeon General; 2001:553-566.
- Paton BC. Cold, casualties, and conquests: the effects of cold on warfare. In: Pandolf KB, Burr RE, eds. Medical Aspects of Harsh Environments, Volume 1. Office of the Surgeon General; 2001:313-349.
- Pozos RS (ed.). Section II: cold environments. In: Pandolf KB, Burr RE, eds. Medical Aspects of Harsh Environments, Volume 1. Office of the Surgeon General; 2001:311-566.
- DeGroot DW, Castellani JW, Williams JO, Amoroso PJ. Epidemiology of U.S. Army cold weather injuries, 1980–1999. Aviat Space Environ Med. 2003;74(5):564-570.
- Headquarters, Department of the Army. Technical Bulletin Medical 508. Prevention and Management of Cold-Weather Injuries. Apr. 1, 2005.
- Headquarters, Department of the Army, Training and Doctrine Command. TRADOC Regulation 350-29: Prevention of Heat and Cold Casualties. Jun. 15, 2023.
- Headquarters, Department of the Army, Training and Doctrine Command. TRADOC Regulation 350-6: Enlisted Initial Entry Training Policies and Administration. Aug. 9, 2019.
- Castellani JW, O’Brien C, Baker-Fulco C, Sawka MN, Young AJ. Sustaining health and performance in cold weather operations. Technical Note TN/02-2. U.S. Army Research Institute of Environmental Medicine. Oct. 2001.
- Armed Forces Health Surveillance Branch. Update: cold weather injuries, active and reserve component, U.S. Armed Forces, July 2013–June 2018. MSMR. 2018;25(11):10-17.
- Armed Forces Health Surveillance Branch. Armed Forces Reportable Events Guidelines and Case Definitions, 2020. https://health.mil/Reference-Center/Publications/2020/01/01/Armed-Forces-Reportable-Medical-Events-Guidelines
- Jolly BT, Ghezzi KT. Accidental hypothermia. Emerg Med Clin North Am. 1992;10(2):311-327.
- Rischall ML, Rowland-Fisher A. Evidence-based management of accidental hypothermia in the emergency department. Emerg Med Pract. 2016;18(1):1-18.
- Biem J, Koehncke N, Classen D, Dosman J. Out of the cold: management of hypothermia and frostbite. CMAJ. 2003;168(3):305-311.
- Imray CH, Oakley EH. Cold still kills: cold-related illnesses in military practice freezing and non-freezing cold injury. J R Army Med Corps. 2005;151(4):218-222. doi:10.1136/jramc-151-04-02
- Ervasti O, Hassi J, Rintamaki H, et al. Sequelae of moderate finger frostbite as assessed by subjective sensations, clinical signs, and thermo-physiological responses. Int J Circumpolar Health. 2000;59(2):137-145.
- Harirchi I, Arvin A, Vash JH, Zafarmand V. Frostbite: incidence and predisposing factors in mountaineers. Br J Sports Med. 2005;39(12):898-901. doi:10.1136/bjsm.2004.016097
- Handford C, Thomas O, Imray CHE. Frostbite. Emerg Med Clin North Am. 2017;35(2):281-299.
- Murphy JV, Banwell PE, Roberts AH, McGrouther DA. Frostbite: pathogenesis and treatment. J Trauma. 2000;48(1):171-178. doi:10.1097/00005373-200001000-00036
- Petrone P, Kuncir EJ, Asensio JA. Surgical management and strategies in the treatment of hypothermia and cold injury. Emerg Med Clin North Am. 2003;21(4):1165-1178. doi:10.1016/s0733-8627(03)00074-9
- Imray C, Grieve A, Dhillon S, Caudwell Xtreme Everest Research Group. Cold damage to the extremities: frostbite and non-freezing cold injuries. Postgrad Med J. 2009;85(1007):481-488. doi:10.1136/pgmj.2008.068635
- Hall A, Sexton J, Lynch B, et al. Frostbite and immersion foot care. Mil Med. 2018;183(suppl 2):168-171. doi:10.1093/milmed/usy085
- van Dongen TTCF, Berendsen RR, de Jong FJM, et al. Frostbite: a systematic review on freezing cold injuries in a military environment. BMJ Mil Health. Epub. doi:10.1136/military-2022-002171
- McMahon JA, Howe A. Cold weather issues in sideline and event management. Curr Sports Med Rep. 2012;11(3):135-141. doi:10.1249/JSR.0b013e3182578783
- Centers for Disease Control and Prevention. Natural Disasters and Severe Weather: Trench Foot or Immersion Foot. https://www.cdc.gov/disasters/trenchfoot.html
- Army Medical Surveillance Activity. Cold injuries, active duty, U.S. Armed Forces, July 1999–June 2004. MSMR. 2004;10(5):2-10.
- Burgess JE, Macfarlane F. Retrospective analysis of the ethnic origins of male British Army soldiers with peripheral cold weather injury. J R Army Med Corps. 2009;155(1):11-15. doi:10.1136/jramc-155-01-04
- Maley MJ, Eglin CM, House JR, Tipton MJ. The effect of ethnicity on the vascular responses to cold exposure of the extremities. Eur J Appl Physiol. 2014;114(11):2369-2379. doi:10.1007/s00421-014-2962-2
- Kuht JA, Woods D, Hollis S. Case series of non-freezing cold injury: epidemiology and risk factors. J R Army Med Corps. 2019;165(6):400-404. doi:10.1136/jramc-2018-000992