
Military Health System

Test of Sitewide Banner

This is a test of the sitewide banner capability. In the case of an emergency, site visitors would be able to visit the news page for addition information.

Update: Incidence of Glaucoma Diagnoses, Active Component, U.S. Armed Forces, 2013–2017

Image of Glaucoma. U.S. Air Force Tech. Sgt. Francisco Govea of the 4th Combat Camera Squadron holds his eyes open during a retinal interocular pressure exam at the 452nd Aerospace Medicine Squadron facility. Photo Courtesy of U.S. Air Force Senior Airman Brianna Veesart.

Abstract

Glaucoma is an eye disease that involves progressive optic nerve damage and vision loss, leading to blindness if undetected or untreated. This report describes an analysis using the Defense Medical Surveillance System to identify all active component service members with an incident diagnosis of glaucoma during the period between 2013 and 2017. The analysis identified 37,718 incident cases of glaucoma and an overall incidence rate of 5.9 cases per 1,000 person-years (p-yrs). The majority of cases (97.6%) were diagnosed at an early stage as borderline glaucoma; of these borderline cases, 2.2% progressed to open-angle glaucoma during the study period. No incident cases of absolute glaucoma, or total blindness, were identified. Rates of glaucoma were higher among non-Hispanic black (11.0 per 1,000 p-yrs), Asian/Pacific Islander (9.5), and Hispanic (6.9) service members, compared with non-Hispanic white (4.0) service members. Rates among female service members (6.6 per 1,000 p-yrs) were higher than those among male service members (5.8). Between 2013 and 2017, incidence rates of glaucoma diagnoses increased by 75.4% among all service members.

What Are the New Findings?

The vast majority of glaucoma diagnoses in active component service members (97.6%) represent early stage disease (borderline or suspect glaucoma). Over the surveillance period, incidence rates of glaucoma diagnoses increased by 75.4% overall; the greatest increase occurred in service members <20 years of age, which may reflect improved detection among younger service members.

What Is the Impact on Readiness and Force Health Protection?

There is no cure for glaucoma, and vision loss caused by glaucoma does not return with treatment; treatment only stops or reduces the rate of new vision loss. Glaucoma prevention efforts should continue to focus on early detection through periodic and comprehensive eye examinations performed by an eye care professional (optometrist or ophthalmologist).

Background

Glaucoma refers to a group of eye diseases that can damage the optic nerve and can result in vision loss and blindness. This condition is often, but not always, associated with elevated intraocular pressure (IOP), also called ocular hypertension. Elevated IOP can be the result of excessive production of aqueous humor, reduced flow of fluid out of the eye, or both. Aqueous humor is a transparent fluid that fills the anterior and posterior chambers of the eye and that flows passively out of the eye. Elevated pressure not relieved by treatment is believed to result in optic nerve damage in most affected individuals.1 Usually, damage to the optic nerve and loss of visual field are gradual and painless; however, there is a form of the disease called acute angle closure in which the trabecular meshwork becomes blocked, leading to a rapid rise in IOP and eye pain. This urgent condition requires immediate treatment.2

A finding of elevated IOP alone is insufficient to diagnose glaucoma, but it is 1 of the findings that can be used to classify a patient with glaucoma suspect or borderline glaucoma. The American Academy of Ophthalmology defines glaucoma suspect as having 1 of the following findings in at least 1 eye: consistently elevated IOP, optic nerve deterioration or nerve fiber layer defect suggestive of glaucoma, or a visual field abnormality consistent with glaucoma. A diagnosis of primary open angle glaucoma (POAG) is supported when 2 or more of these findings are present, especially in the presence of other established risk factors.3,4 POAG is the most common form of glaucoma. In this form, the drainage area between the cornea and the iris, which forms an angle, is open but aqueous fluid flow is inadequate. In angle-closure glaucoma, the angle is reduced or blocked by the iris. Other less common forms of the disease include steroid-induced glaucoma and disease associated with developmental anomalies and systemic syndromes. There are also congenital forms of the disease that are diagnosed at birth or in early childhood.1 The end stage of the disease, termed absolute glaucoma, is total blindness.

Risk factors for the development of glaucoma include elevated IOP, being 60 years of age or older, being of black, Asian, or Hispanic race/ethnicity, and having a family history of glaucoma.5,6 Comorbid conditions associated with increased risk for glaucoma include hypertension, diabetes, uveitis, eye injuries, and eye conditions requiring extended corticosteroid use.6

Among U.S. adults, glaucoma ranks among the top 3 most common causes of blindness.7 Estimates of glaucoma prevalence in the U.S. vary widely based on study population and whether estimates include those considered borderline or glaucoma suspect. Using data from the 2005–2008 National Health and Nutrition Examination Survey (NHANES), Gupta et al. estimated that the overall prevalence of glaucoma in U.S. civilians 40 years of age or older is 2.1%, which represents approximately 2.9 million cases.8

Glaucoma is considered a disqualifying condition for enlistment in the military.9 Glaucoma that is diagnosed while in service but deemed resistant to treatment or that affects the visual field will be evaluated by a medical evaluation board for possible separation from service.9 A prior MSMR analysis identified more than 117,000 incident cases of glaucoma in active component service members between 1998–2013 but noted that incidence rates had declined for those service members 44 years of age or older during the surveillance period.10 In addition, 94.5% of cases were borderline or glaucoma suspect cases.10 The current analysis updates the prior MSMR report using data from 2013–2017.

Methods

The Defense Medical Surveillance System (DMSS) was used to identify all active component service personnel (Army, Navy, Air Force, and Marines) whose health care records contained a diagnosis of glaucoma during 1 Jan. 2013 through 31 Dec. 2017. The DMSS contains administrative records for all medical encounters of military service members who are hospitalized or receive ambulatory care at military treatment facilities or through civilian Purchased CareThe TRICARE Health Program is often referred to as purchased care. It is the services we “purchase” through the managed care support contracts.purchased care if paid for by the Military Health System. A case of glaucoma was defined as having 1) at least 1 inpatient encounter with a diagnosis of glaucoma in any diagnostic position, 2) at least 1 outpatient encounter from an optometry or ophthalmology clinic (Medical Expense and Reporting System code beginning with "BBD" or "BHC") with a diagnosis of glaucoma in any diagnostic position, or 3) at least 2 outpatient or in-theater (Theater Medical Data Store) medical encounters within 180 days with a diagnosis of glaucoma in any diagnostic position.;

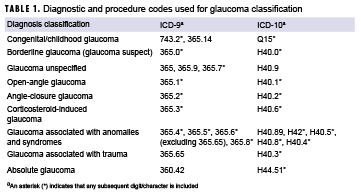
The incidence date was defined as the earliest medical encounter that qualified the service member as a case. An individual was counted as an incident case only once during the study period, and person-time for service members with glaucoma was censored at the time of the incident diagnosis. Service members with incident diagnoses prior to 2013 or with an incident diagnosis while in the reserve or guard components were excluded. Denominators for incidence rates of glaucoma were calculated based on the total active component person-time in years for each year in the study period. The ICD-9 and ICD-10 codes used to define glaucoma, including classi­fication of glaucoma type, are provided in Table 1.

Disease progression was analyzed by evaluating changes in glaucoma type over time for each service member. A glaucoma case was estimated to have progressed if the incident diagnosis was for borderline, congenital, or unspecified glaucoma and was followed by a medical encounter with a diagnosis that was more specific or severe than the initial diagnosis (e.g., open-angle, angle-closure, or absolute).

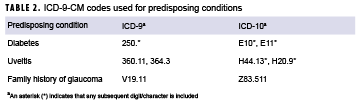
In addition to estimating the incidence of glaucoma, the overall burden of glaucoma was measured by counting the number of medical encounters with a primary diagnosis of glaucoma. Risk factors for glaucoma were also identified. These conditions were defined by having at least 1 diagnosis in any diagnostic position of diabetes, family history of glaucoma, or uveitis (Table 2) occurring on or prior to the incident diagnosis of glaucoma.

The average time from incident diagnosis to separation from military service was measured overall and by incident glaucoma type. This analysis was performed on a sub-group of service members who left service between 2013 and 2017 and included incident cases of glaucoma that were diagnosed prior to 2013.

Results

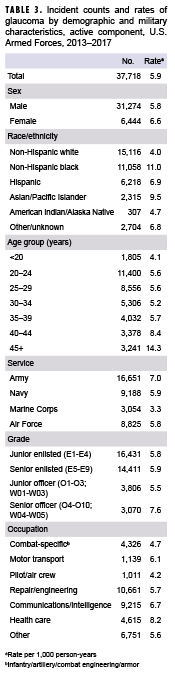
During the 5-year surveillance period, a total of 37,718 incident cases of glaucoma were identified. This represents an overall incidence rate of 5.9 per 1,000 person-years (p-yrs) (Table 3). The rate of incident glaucoma diagnoses among female service members (6.6 per 1,000 p-yrs) was 14% higher than that of male service members (5.8 per 1,000 p-yrs). The rate was highest among non-Hispanic black service members (11.0 per 1,000 p-yrs) and it was more than double the rate among non-Hispanic white service members (4.0 per 1,000 p-yrs). Rates among both Asian/Pacific Islander (9.5 per 1,000 p-yrs) and Hispanic (6.9 per 1,000 p-yrs) service members were also elevated in comparison with non-Hispanic white service members.

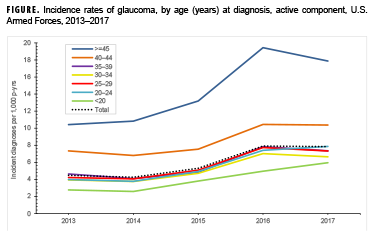
The incidence rate of glaucoma diagnosis increased with increasing age (Table 3). Between 2013 and 2017, incidence rates of glaucoma diagnoses increased by 75.4% among all service members (Figure). When viewed over time, rates among service members increased over the surveillance period in all age groups (Figure). The rate in 2017 among service members aged 45 years or older was 17.9 per 1,000 p-yrs. This represents an increase of 71.5% from 2013. The 2017 rate demonstrated an 8% decline from the 2016 rate, which, at 19.4 cases per 1,000 p-yrs, was the highest rate during the surveillance period. Glaucoma diagnosis rates among service members younger than 20 years of age increased 115% over the study period. (Figure)

Overall, the incidence rate of glaucoma diagnosis was highest among Army personnel (7.0 per 1,000 p-yrs) and lowest among Marines (3.3 per 1,000 p-yrs) (Table 3). Junior officers (5.5 per 1,000 p-yrs) had the lowest rates by grade, followed by junior enlisted (5.8 per 1,000 p-yrs) and senior enlisted (5.9 per 1,000 p-yrs) personnel. Senior officers had the highest rates of glaucoma diagnoses compared to their junior and enlisted counterparts. When stratified by occupational category, service members whose primary occupational code categorized them in health care or communications/intelligence occupations had higher rates of glaucoma diagnoses than those working in other occupations.

Diagnosis categories and disease progression

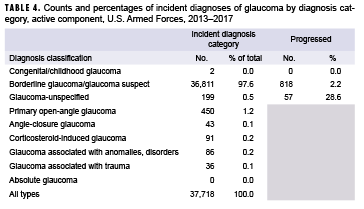
When the incident diagnoses were grouped by disease type, 97.6% of the cases were classified as borderline glaucoma or glaucoma suspect (Table 4). The next largest category was POAG, which represented 1.2% of the cases. Less than 1 percent of the incident cases were coded as any other type of glaucoma. Of those service members with an initial diagnosis of borderline glaucoma, 2.2% later received a diagnosis of POAG or other more severe glaucoma diagnoses.

Burden

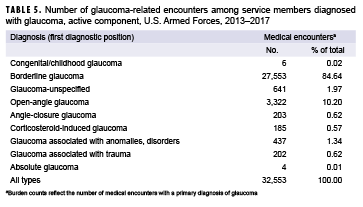
Among 37,718 diagnosed cases, there were 32,553 such medical encounters. An individual could become a diagnosed case without receiving a glaucoma diagnosis in the primary diagnostic position; however, to be counted in the burden analysis, a glaucoma diagnosis was required to be in the primary diagnostic position which accounts for the difference in the number of diagnosed cases versus the number of medical encounters ascertained in the burden analysis. Table 5 shows the number and percentage of medical encounters when categorized by the glaucoma diagnosis made in the primary diagnostic position. Even though borderline glaucoma represented 97.6% of the incident cases, this diagnosis represented only 84.6% of total medical encounters with a glaucoma diagnosis in the first diagnostic position. The 1.2% of service members with an incident diagnosis of POAG or who progressed to POAG utilized 10.2% of total medical encounters.

Comorbidities

Overall, 1.6% of those with a glaucoma diagnosis had also been diagnosed with diabetes, while less than 1% (0.3%) of glaucoma cases had a family history of glaucoma documented via diagnosis prior to their glaucoma diagnosis. Pre-existing uveitis was more common among those with glaucoma associated with anomalies and other disorders (22.1%) and in those with unspecified glaucoma (4.0%), while overall, 1.1% of all incident glaucoma cases had a pre-existing uveitis diagnosis (data not shown). 

Career impact

The median time to separation or death among service members diagnosed with glaucoma did not vary much when analyzed by the incident diagnosis. On average, the shortest amount of time served following the initial diagnosis with any type of glaucoma occurred among those initially diagnosed with corticosteroid-induced glaucoma (3.3 years), followed by those diagnosed with glaucoma associated with trauma (3.8 years) (data not shown). The longest amount of time served following initial diagnosis occurred among those initially diagnosed with POAG (8.3 years). On average, service members served for 4.5 years following any initial glaucoma diagnosis (data not shown).

Editorial Comment

The results of this analysis indicate that most service members (97.6%) initially diagnosed with glaucoma are in the early stages of the disease (borderline or suspect glaucoma). This finding is similar to the previous MSMR analysis in which 94.5% of incident glaucoma diagnoses fell into this category.10 These diagnoses of borderline glaucoma/glaucoma suspect may reflect cases with transient elevation in IOP, which may never result in nerve damage. Most types of glaucoma progress slowly and can be managed well with medication to reduce aqueous fluid production or increase fluid outflow. Eventually, some cases may require surgery to enable better fluid drainage.1,2 Among service members whose disease progressed beyond the borderline diagnosis, prior to separation from service or the end of the study period, the most common form of glaucoma was POAG.

The incidence rates of glaucoma diagnoses increased with age and among all age groups over the study period. The greatest increase over time in rates occurred among the youngest age groups. These findings may reflect improved detection of borderline glaucoma among younger service members. The striking increase in incidence rates in younger service members likely reflects increased ascertainment, possibly due to more frequent measurement of intraocular pressure in this population. Incidence rates by service were lowest among Marines, which likely reflects the younger age distribution of this service. Rates by occupational category at incident diagnosis were highest among health care workers, possibly due to increased health care-seeking behaviors in this group.
As seen in civilian populations, incidence of glaucoma was higher among non-Hispanic black, Asian/Pacific Islander, and Hispanic service members compared with non-Hispanic white or American Indian/Alaska Native service members.

Not surprisingly, the majority of medical encounters for glaucoma (85%) had a primary diagnosis indicating borderline or glaucoma suspect. Because the majority of incident cases in this analysis were classified as borderline glaucoma or glaucoma suspect, this finding is not unexpected. Notably, this finding differs from the previous MSMR analysis of glaucoma burden because of differences in the methodology used to assess the burden of disease. The 2014 MSMR analysis included any medical encounters with any diagnosis of glaucoma in any diagnostic position in assessing the burden of disease for glaucoma cases.10 In addition, the prior burden analysis attributed glaucoma medical encounters to the most severe glaucoma diagnosis a case had received. In other words, if the most severe diagnosis a case had received was for POAG, burden medical encounters would be attributed to POAG, even when the medical encounter itself may have had a less severe diagnosis (e.g. borderline or glaucoma suspect) listed in the primary diagnostic position. In contrast, the current burden analysis classified medical encounters by the glaucoma diagnosis listed in the primary diagnostic position of the medical encounter, which is consistent with the standard MSMR burden methodology used in its annual burden analysis.11 The net result of this difference in methodology is that fewer medical encounters overall were included in the burden analysis and a greater proportion of encounters were classified as borderline or glaucoma suspect. These findings should be interpreted in light of this methodological difference.

Most types of glaucoma cause no symptoms until damage to the optic nerve and visual field loss is substantial. For this reason, the National Eye Institute of the National Institutes of Health recommends that individuals with risk factors for glaucoma should receive regular comprehensive dilated eye exams. Those with increased risk include anyone with a family history of glaucoma, those with diabetes, African Americans older than 40 years of age, and individuals 60 years of age or older.12

One limitation of this analysis is that an unknown number of the incident diagnoses of borderline glaucoma may reflect a transient elevation of IOP, which, while properly identified during the medical encounter, may never progress to glaucoma, which requires damage to the optic nerve. Therefore, the incidence rates of glaucoma reported here are likely overestimates of the population truly at risk for advanced disease. It is also possible that many service members diagnosed with borderline glaucoma did not receive a subsequent diagnosis with a more advanced form of the disease during the period covered by this analysis because of the slow nature of the progression of the disease and the fact that many separate from service before the disease becomes problematic.

References

  1. Cioffi G. Section 10: Glaucoma. 2011–2012 Basic and Clinical Science Course: American Academy of Ophthalmology. 2012:1–12.
  2. National Eye Institute. Facts About Glaucoma. https://www.nei.nih.gov/health/glaucoma/glaucoma_facts. Accessed on 18 Nov. 2014.
  3. American Academy of Opthamology. Preferred practice pattern: Primary open-angle glaucoma. Nov. 2015. http://one.aao.org/. Accessed on 02 Jan. 2019.
  4. American Academy of Opthamology. Preferred practice pattern: Primary open-angle glaucoma suspect. Nov. 2015. http://one.aao.org/. Accessed on 02 Jan. 2019.
  5. Mayo Clinic. Diseases and Conditions, Glaucoma. http://www.mayoclinic.org/diseases-conditions/glaucoma/basics/risk-factors/con-20024042. Accessed on 18 Nov. 2014.
  6. Zhang X, Cotch MF, Ryskulova A, et al. Vision health disparities in the United States by race/ethnicity, education, and economic status: Findings from two nationally representative surveys. Am J Ophthalmol. 2012;154(6 Suppl):S53–S62 e51.
  7. Centers for Disease Control and Prevention. Vision Health Initiative (VHI). https://www.cdc.gov/visionhealth/basics/ced/index.html. Accessed on 10 Jan. 2019.
  8. Gupta P, Zhao D, Guallar E, Ko F, Boland MV, Friedman DS. Prevalence of glaucoma in the United States: The 2005-2008 National Health and Nutrition Examination Survey. Invest Ophthalmol Vis Sci. 2016;57(6):2905–2913.
  9. Department of Defense Instruction 6130.03. Medical Standards for Appointment, Enlistment, or Induction in the Military Services. 2011.
  10. Hurt L. Glaucoma, active component, U.S. Armed Forces, 1998-2013. MSMR. 2014;21(12):17-23.
  11. Armed Forces Health Surveillance Branch. Morbidity burdens attributable to various illnesses and injuries, deployed active and reserve component service members, U.S. Armed Forces, 2017. MSMR. 2018;25(5):26–31.
  12. National Eye Institute. National Eye Institute Statement on Detection of Glaucoma and Adult Vision Screening. https://www.nei.nih.gov/nehep/programs/glaucoma/detection. Accessed on 24 Dec. 2018.

Incidence rates of glaucoma, by age (years) at diagnosis, active component, U.S. Armed Forces, 2013–2017

Diagnostic and procedure codes used for glaucoma classification

ICD-9-CM codes used for predisposing conditions

Incident counts and rates of glaucoma by demographic and military characteristics, active component, U.S. Armed Forces, 2013–2017

Counts and percentages of incident diagnoses of glaucoma by diagnosis category, active component, U.S. Armed Forces, 2013–2017

Number of glaucoma-related encounters among service members diagnosed with glaucoma, active component, U.S. Armed Forces, 2013–2017

You also may be interested in...

Incidence, Timing, and Seasonal Patterns of Heat Illnesses During U.S. Army Basic Combat Training, 2014–2018

Article
4/1/2019
U.S. Marines participate in morning physical training during a field exercise at Marine Corps Base Camp Pendleton, California. (Photo Courtesy: U.S. Marine Corps)

Risk factors for heat illnesses (HIs) among new soldiers include exercise intensity, environmental conditions at the time of exercise, a high body mass index, and conducting initial entry training during hot and humid weather when recruits are not yet acclimated to physical exertion in heat. This study used data from the Defense Health Agency’s–Weather-Related Injury Repository to calculate rates and to describe the incidence, timing, and geographic distribution of HIs among soldiers during U.S. Army basic combat training (BCT). From 2014 through 2018, HI events occurred in 1,210 trainees during BCT, resulting in an overall rate of 3.6 per 10,000 BCT person-weeks (p-wks) (95% CI: 3.4–3.8). HI rates (cases per 10,000 BCT p-wks) varied among the 4 Army BCT sites: Fort Benning, GA (6.8); Fort Jackson, SC (4.4); Fort Sill, OK (1.8); and Fort Leonard Wood, MO (1.7). Although the highest rates ofHIs occurred at Fort Benning, recruits in all geographic areas were at risk. The highest rates of HI occurred during the peak training months of June through Sept., and over half of all HI cases affected soldiers during the first 3 weeks of BCT. Prevention of HI among BCT soldiers requires relevant training of both recruits and cadre as well as the implementation of effective preventive measures.

Update: Exertional Hyponatremia, Active Component, U.S. Armed Forces, 2003–2018

Article
4/1/2019
Drink water the day before and during physical activity or if heat is going to become a factor. (Photo Courtesy: U.S. Air Force)

From 2003 through 2018, there were 1,579 incident diagnoses of exertional hyponatremia among active component service members, for a crude overall incidence rate of 7.2 cases per 100,000 person-years (p-yrs). Compared to their respective counterparts, females, those less than 20 years old, and recruit trainees had higher overall incidence rates of exertional hyponatremia diagnoses. The overall incidence rate during the 16-year period was highest in the Marine Corps, intermediate in the Army and Air Force, and lowest in the Navy. Overall rates during the surveillance period were highest among Asian/Pacific Islander and non-Hispanic white service members and lowest among non-Hispanic black service members. Between 2003 and 2018, crude annual incidence rates of exertional hyponatremia peaked in 2010 (12.7 per 100,000 p-yrs) and then decreased to 5.3 cases per 100,000 p-yrs in 2013 before increasing in 2014 and 2015. The crude annual rate in 2018 (6.3 per 100,000 p-yrs) represented a decrease of 26.5% from 2015. Service members and their supervisors must be knowledgeable of the dangers of excessive water consumption and the prescribed limits for water intake during prolonged physical activity (e.g., field training exercises, personal fitness training, and recreational activities) in hot, humid weather.

Update: Exertional Rhabdomyolysis, Active Component, U.S. Armed Forces, 2014–2018

Article
4/1/2019
U.S. Marines sprint uphill during a field training exercise at Marine Corps Air Station Miramar, California. to maintain contact with an aviation combat element, teaching and sustaining their proficiency in setting up and maintaining communication equipment.  (Photo Courtesy: U.S. Marine Corps)

Among active component service members in 2018, there were 545 incident diagnoses of rhabdomyolysis likely due to exertional rhabdomyolysis, for an unadjusted incidence rate of 42.0 cases per 100,000 person-years. Subgroup-specific rates in 2018 were highest among males, those less than 20 years old, Asian/Pacific Islander service members, Marine Corps and Army members, and those in combat-specific or “other/unknown” occupations. During 2014–2018, crude rates of exertional rhabdomyolysis increased steadily from 2014 through 2016 after which rates declined slightly in 2017 before increasing again in 2018. Compared to service members in other race/ethnicity groups, the overall rate of exertional rhabdomyolysis was highest among non-Hispanic blacks in every year except 2018. Overall and annual rates were highest among Marine Corps members, intermediate among those in the Army, and lowest among those in the Air Force and Navy. Most cases of exertional rhabdomyolysis were diagnosed at installations that support basic combat/recruit training or major ground combat units of the Army or the Marine Corps. Medical care providers should consider exertional rhabdomyolysis in the differential diagnosis when service members (particularly recruits) present with muscular pain or swelling, limited range of motion, or the excretion of dark urine (possibly due to myoglobinuria) after strenuous physical activity, particularly in hot, humid weather.

Update: Heat Illness, Active Component, U.S. Armed Forces, 2018

Article
4/1/2019
Drink water the day before and during physical activity or if heat is going to become a factor. (Photo Courtesy: U.S. Air Force)

In 2018, there were 578 incident diagnoses of heat stroke and 2,214 incident diagnoses of heat exhaustion among active component service members. The overall crude incidence rates of heat stroke and heat exhaustion diagnoses were 0.45 cases and 1.71 cases per 1,000 person-years, respectively. In 2018, subgroup-specific rates of incident heat stroke diagnoses were highest among males and service members less than 20 years old, Asian/Pacific Islanders, Marine Corps and Army members, recruit trainees, and those in combat-specific occupations. Subgroup-specific incidence rates of heat exhaustion diagnoses in 2018 were notably higher among service members less than 20 years old, Asian/Pacific Islanders, Army and Marine Corps members, recruit trainees, and service members in combat-specific occupations. During 2014–2018, a total of 325 heat illnesses were documented among service members in Iraq and Afghanistan; 8.6% (n=28) were diagnosed as heat stroke. Commanders, small unit leaders, training cadre, and supporting medical personnel must ensure that the military members whom they supervise and support are informed about the risks, preventive countermeasures, early signs and symptoms, and first-responder actions related to heat illnesses.

Vasectomy and Vasectomy Reversals, Active Component, U.S. Armed Forces, 2000–2017

Article
3/1/2019
Sperm is the male reproductive cell  Photo: iStock

During 2000–2017, a total of 170,878 active component service members underwent a first-occurring vasectomy, for a crude overall incidence rate of 8.6 cases per 1,000 person-years (p-yrs). Among the men who underwent incident vasectomy, 2.2% had another vasectomy performed during the surveillance period. Compared to their respective counterparts, the overall rates of vasectomy were highest among service men aged 30–39 years, non-Hispanic whites, married men, and those in pilot/air crew occupations. Male Air Force members had the highest overall incidence of vasectomy and men in the Marine Corps, the lowest. Crude annual vasectomy rates among service men increased slightly between 2000 and 2017. The largest increases in rates over the 18-year period occurred among service men aged 35–49 years and among men working as pilots/air crew. Among those who underwent vasectomy, 1.8% also had at least 1 vasectomy reversal during the surveillance period. The likelihood of vasectomy reversal decreased with advancing age. Non-Hispanic black and Hispanic service men were more likely than those of other race/ethnicity groups to undergo vasectomy reversals.

Testosterone Replacement Therapy Use Among Active Component Service Men, 2017

Article
3/1/2019
Testosterone

This analysis summarizes the prevalence of testosterone replacement therapy (TRT) during 2017 among active component service men by demographic and military characteristics. This analysis also determines the percentage of those receiving TRT in 2017 who had an indication for receiving TRT using the 2018 American Urological Association (AUA) clinical practice guidelines. In 2017, 5,093 of 1,076,633 active component service men filled a prescription for TRT, for a period prevalence of 4.7 per 1,000 male service members. After adjustment for covariates, the prevalence of TRT use remained highest among Army members, senior enlisted members, warrant officers, non-Hispanic whites, American Indians/Alaska Natives, those in combat arms occupations, healthcare workers, those who were married, and those with other/unknown marital status. Among active component male service members who received TRT in 2017, only 44.5% met the 2018 AUA clinical practice guidelines for receiving TRT.

Brief Report: Male Infertility, Active Component, U.S. Armed Forces, 2013–2017

Article
3/1/2019
Sperm is the male reproductive cell  Photo: iStock

Infertility, defined as the inability to achieve a successful pregnancy after 1 year or more of unprotected sexual intercourse or therapeutic donor insemination, affects approximately 15% of all couples. Male infertility is diagnosed when, after testing both partners, reproductive problems have been found in the male. A male factor contributes in part or whole to about 50% of cases of infertility. However, determining the true prevalence of male infertility remains elusive, as most estimates are derived from couples seeking assistive reproductive technology in tertiary care or referral centers, population-based surveys, or high-risk occupational cohorts, all of which are likely to underestimate the prevalence of the condition in the general U.S. population.

Sexually Transmitted Infections, Active Component, U.S. Armed Forces, 2010–2018

Article
3/1/2019
Neisseria gonorrhoeae Photo Courtesy of CDC: M Rein

This report summarizes incidence rates of the 5 most common sexually transmitted infections (STIs) among active component service members of the U.S. Armed Forces during 2010–2018. Infections with chlamydia were the most common, followed in decreasing order of frequency by infections with genital human papillomavirus (HPV), gonorrhea, genital herpes simplex virus (HSV), and syphilis. Compared to men, women had higher rates of all STIs except for syphilis. In general, compared to their respective counterparts, younger service members, non-Hispanic blacks, soldiers, and enlisted members had higher incidence rates of STIs. During the latter half of the surveillance period, the incidence of chlamydia and gonorrhea increased among both male and female service members. Rates of syphilis increased for male service members but remained relatively stable among female service members. In contrast, the incidence of genital HPV and HSV decreased among both male and female service members. Similarities to and differences from the findings of the last MSMR update on STIs are discussed.

Outbreak of Acute Respiratory Illness Associated with Adenovirus Type 4 at the U.S. Naval Academy, 2016

Article
2/1/2019
Malaria case definition

Human adenoviruses (HAdVs) are known to cause respiratory illness outbreaks at basic military training (BMT) sites. HAdV type-4 and -7 vaccines are routinely administered at enlisted BMT sites, but not at military academies. During Aug.–Sept. 2016, U.S. Naval Academy clinical staff noted an increase in students presenting with acute respiratory illness (ARI). An investigation was conducted to determine the extent and cause of the outbreak. During 22 Aug.–11 Sept. 2016, 652 clinic visits for ARI were identified using electronic health records. HAdV-4 was confirmed by real-time polymerase chain reaction assay in 18 out of 33 patient specimens collected and 1 additional HAdV case was detected from hospital records. Two HAdV-4 positive patients were treated for pneumonia including 1 hospitalized patient. Molecular analysis of 4 HAdV-4 isolates identified genome type 4a1, which is considered vaccine-preventable. Understanding the impact of HAdV in congregate settings other than enlisted BMT sites is necessary to inform discussions regarding future HAdV vaccine strategy.

Re-evaluation of the MSMR Case Definition for Incident Cases of Malaria

Article
2/1/2019
Anopheles merus

The MSMR has been publishing the results of surveillance studies of malaria since 1995. The standard MSMR case definition uses Medical Event Reports and records of hospitalizations in counting cases of malaria. This report summarizes the performance of the standard MSMR case definition in estimating incident cases of malaria from 2015 through 2017. Also explored was the potential surveillance value of including outpatient encounters with diagnoses of malaria or positive laboratory tests for malaria in the case definition. The study corroborated the relative accuracy of the MSMR case definition in estimating malaria incidence and provided the basis for updating the case definition in 2019 to include positive laboratory tests for malaria antigen within 30 days of an outpatient diagnosis.

Update: Malaria, U.S. Armed Forces, 2018

Article
2/1/2019
Anopheles merus

Malaria infection remains an important health threat to U.S. service mem­bers who are located in endemic areas because of long-term duty assign­ments, participation in shorter-term contingency operations, or personal travel. In 2018, a total of 58 service members were diagnosed with or reported to have malaria. This represents a 65.7% increase from the 35 cases identi­fied in 2017. The relatively low numbers of cases during 2012–2018 mainly reflect decreases in cases acquired in Afghanistan, a reduction due largely to the progressive withdrawal of U.S. forces from that country. The percentage of cases of malaria caused by unspecified agents (63.8%; n=37) in 2018 was the highest during any given year of the surveillance period. The percent­age of cases identified as having been caused by Plasmodium vivax (10.3%; n=6) in 2018 was the lowest observed during the 10-year surveillance period. The percentage of malaria cases attributed to P. falciparum (25.9 %) in 2018 was similar to that observed in 2017 (25.7%), although the number of cases increased. Malaria was diagnosed at or reported from 31 different medical facilities in the U.S., Afghanistan, Italy, Germany, Djibouti, and Korea. Pro­viders of medical care to military members should be knowledgeable of and vigilant for clinical manifestations of malaria outside of endemic areas.

Thyroid Disorders, Active Component, U.S. Armed Forces, 2008–2017

Article
12/1/2018
Cover 1

This analysis describes the incidence and prevalence of five thyroid disorders (goiter, thyrotoxicosis, primary/not otherwise specified [NOS] hypothyroidism, thyroiditis, and other disorders of the thyroid) among active component service members between 2008 and 2017. During the 10-year surveillance period, the most common incident thyroid disorder among male and female service members was primary/NOS hypothyroidism and the least common were thyroiditis and other disorders of thyroid. Primary/NOS hypothyroidism was diagnosed among 8,641 females (incidence rate: 43.7 per 10,000 person-years [p-yrs]) and 11,656 males (incidence rate: 10.2 per 10,000 p-yrs). Overall incidence rates of all thyroid disorders were 3 to 5 times higher among females compared to males. Among both males and females, incidence of primary/NOS hypothyroidism was higher among non-Hispanic white service members compared with service members in other race/ethnicity groups. The incidence of most thyroid disorders remained stable or decreased during the surveillance period. Overall, the prevalence of most thyroid disorders increased during the first part of the surveillance period and then either decreased or leveled off.31.6 per 100,000 active component service members in 2017. Validation of ICD-9/ICD-10 diagnostic codes for MetS using the National Cholesterol Education Program Adult Treatment Panel III criteria is needed to establish the level of agreement between the two methods for identifying this condition.

Incidence and Prevalence of the Metabolic Syndrome Using ICD-9 and ICD-10 Diagnostic Codes, Active Component, U.S. Armed Forces, 2002–2017

Article
12/1/2018
Incidence and Prevalence of the Metabolic Syndrome Using ICD-9 and ICD-10 Diagnostic Codes, Active Component, U.S. Armed Forces, 2002–2017

This report uses ICD-9 and ICD-10 codes (277.7 and E88.81, respectively) for the metabolic syndrome (MetS) to summarize trends in the incidence and prevalence of this condition among active component members of the U.S. Armed Forces between 2002 and 2017. During this period, the crude overall incidence rate of MetS was 7.5 cases per 100,000 person-years (p-yrs). Compared to their respective counterparts, overall incidence rates were highest among Asian/Pacific Islanders, Air Force members, and warrant officers and were lowest among those of other/unknown race/ethnicity, Marine Corps members, and junior enlisted personnel and officers. During 2002–2017, the annual incidence rates of MetS peaked in 2009 at 11.6 cases per 100,000 p-yrs and decreased to 5.9 cases per 100,000 p-yrs in 2017. Annual prevalence rates of MetS increased steadily during the first 11 years of the surveillance period reaching a high of 38.9 per 100,000 active component service members in 2012, after which rates declined slightly to 31.6 per 100,000 active component service members in 2017. Validation of ICD-9/ICD-10 diagnostic codes for MetS using the National Cholesterol Education Program Adult Treatment Panel III criteria is needed to establish the level of agreement between the two methods for identifying this condition.

Adrenal Gland Disorders, Active Component, U.S. Armed Forces, 2002–2017

Article
12/1/2018
Adrenal Gland Disorders, Active Component, U.S. Armed Forces, 2002–2017

During 2002–2017, the most common incident adrenal gland disorder among male and female service members was adrenal insufficiency and the least common was adrenomedullary hyperfunction. Adrenal insufficiency was diagnosed among 267 females (crude overall incidence rate: 8.2 cases per 100,000 person-years [p-yrs]) and 729 males (3.9 per 100,000 p-yrs). In both sexes, overall rates of other disorders of adrenal gland and Cushing’s syndrome were lower than for adrenal insufficiency but higher than for hyperaldosteronism, adrenogenital disorders, and adrenomedullary hyperfunction. Crude overall rates of adrenal gland disorders among females tended to be higher than those of males, with female:male rate ratios ranging from 2.1 for adrenal insufficiency to 5.5 for androgenital disorders and Cushing’s syndrome. The highest overall rates of adrenal insufficiency for males and females were among non-Hispanic white service members. Among females, rates of Cushing's syndrome and other disorders of adrenal gland were 31.6 per 100,000 active component service members in 2017. Validation of ICD-9/ICD-10 diagnostic codes for MetS using the National Cholesterol Education Program Adult Treatment Panel III criteria is needed to establish the level of agreement between the two methods for identifying this condition.

Page 14 of 14 , showing items 196 - 209
First < ... 11 12 13 14 > Last 
Refine your search
Last Updated: October 24, 2022
Follow us on Instagram Follow us on LinkedIn Follow us on Facebook Follow us on Twitter Follow us on YouTube Sign up on GovDelivery