Background
Military populations have historically been at high risk for acute respiratory infections, particularly training and deployed populations, who have living conditions that are often crowded and may be austere.1 Respiratory infections are responsible for over 300,000 medical encounters each year among U.S. active component service members, and the associated health care creates a substantial public health and economic burden on the Military Health System (MHS).1,2 Respiratory infections also account for approximately one-third of convalescence in quarters determinations and as such are a significant contributor to lost duty days.3 Viral respiratory pathogens are highly transmissible, and the specific types, trends, and risks often vary regionally and by setting.1 These variations are important for a globally dispersed force, as they inform risk assessments and ensure that proper preventive measures are implemented. Thus, the Department of Defense (DOD) conducts surveillance for respiratory infections both within the force and in other global populations. The Armed Forces Health Surveillance Branch's (AFHSB) Global Emerging Infections Surveillance (GEIS) section supports a global surveillance program, executed primarily by DOD service laboratories, at approximately 400 locations in over 30 countries. Respiratory infection surveillance data are regularly shared with the World Health Organization (WHO) and the Centers for Disease Control and Prevention (CDC). Because of frequent genetic mutations and the associated pandemic potential, influenza is of particular interest to the DOD and is a major focus of these surveillance efforts. Because influenza vaccination is the primary preventive countermeasure, the seasonal influenza vaccine's effectiveness is also closely monitored. Estimates of vaccine effectiveness (VE) are calculated twice annually: during the middle and at the end of the influenza season.
Methods
Three sites produced VE estimates for the DOD at midseason. The U.S. Air Force School of Aerospace Medicine/AFHSB-Air Force (USAFSAM/AFHSBAF) satellite VE estimate was produced from sentinel site surveillance within non-active component MHS beneficiaries (retirees and family members) receiving care at military treatment facilities (MTFs). The Naval Health Research Center (NHRC) VE estimate was derived from sentinel site influenza surveillance within civilian populations at clinics near the U.S.–Mexico border and among MHS beneficiaries (service members, retirees, and family members) receiving care at MTFs. The AFHSB's Epidemiology and Analysis (E&A) section VE estimate was derived from electronic health record (EHR) data from active component service members receiving care at MTFs.
For the 2018–2019 midseason, all 3 VE estimates were calculated using a test-negative case-control study design; crude and adjusted VE estimates, along with 95% confidence intervals (CIs), were calculated as (1 - odds ratio) x 100% and were obtained from multivariable logistic regression models. VE results were considered statistically significant if 95% CIs around VE estimates did not include zero.
USAFSAM/AFHSB-AF satellite's analysis adjusted for age group, time of specimen collection, region, and sex. NHRC's analysis adjusted for age group. AFHSB E&A's analysis adjusted for age group, month of diagnosis, 5-year vaccination status as a dichotomous variable, and sex. Analyses were performed for influenza types and subtypes as available. Cases were laboratory confirmed as influenza positive, and controls were influenza test negative. At NHRC and USAFSAM/AFHSB-AF satellite, influenza positives were confirmed through reverse transcription polymerase chain reaction (RT-PCR) and/or viral culture. AFHSB also used these methods for confirmation and included positive rapid tests, but individuals with only a negative rapid test, without another confirmatory test result were excluded from calculation of VE. USAFSAM/AFHSB-AF satellite verified vaccination status through EHR and self-report data, E&A verified vaccination status through EHR data, and NHRC used self-reported vaccination data. Nearly all vaccinated active duty and beneficiary patients received the inactivated influenza vaccine.
Results
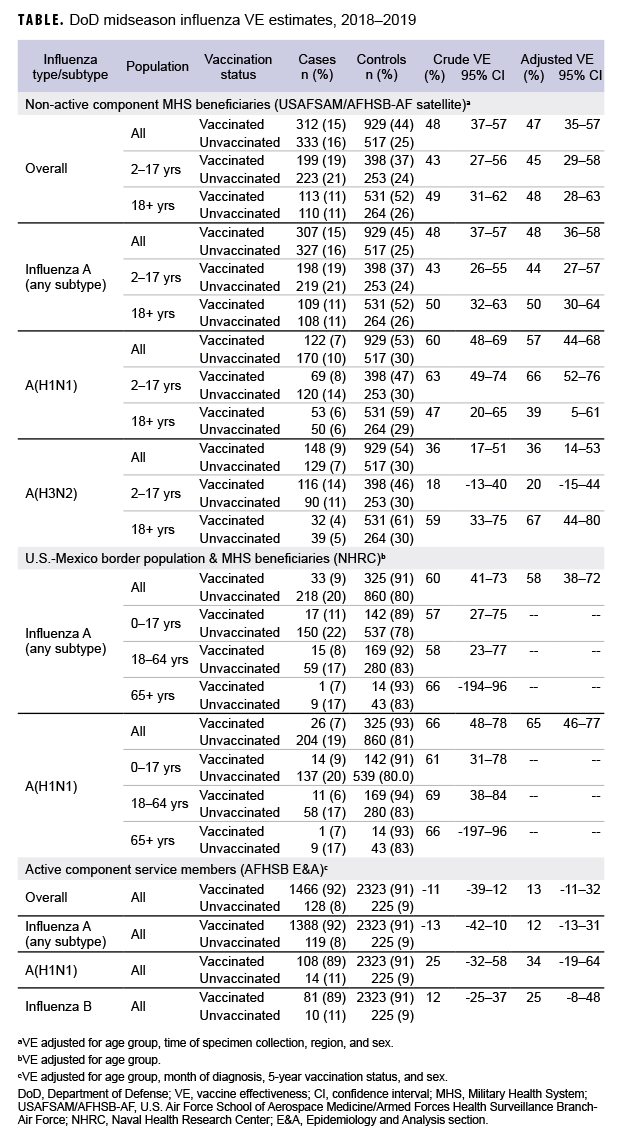
Non-active component MHS beneficiary data were collected from 9 Dec. 2018 through 16 Feb. 2019. The analysis was restricted to this time period to provide a more accurate VE estimate, as earlier months of the influenza season are control-heavy. By the end of the surveillance period, 48% of 645 cases and 64% of 1,446 controls had been vaccinated (Table). Non-active component MHS beneficiary cases tended to be younger than controls. U.S.–Mexico border population civilian and MHS beneficiary data were collected from 30 Sept. 2018 through 15 Feb. 2019, during which time 13% of 251 cases and 27% of 1,185 controls were vaccinated. Border population and MHS beneficiary cases tended to be younger than controls. Active component service member data were collected from 1 Dec. 2018 through 16 Feb. 2019, and 92% of 1,594 cases and 91% of 2,548 controls were vaccinated. In the active component service member group, controls tended to be younger than cases.
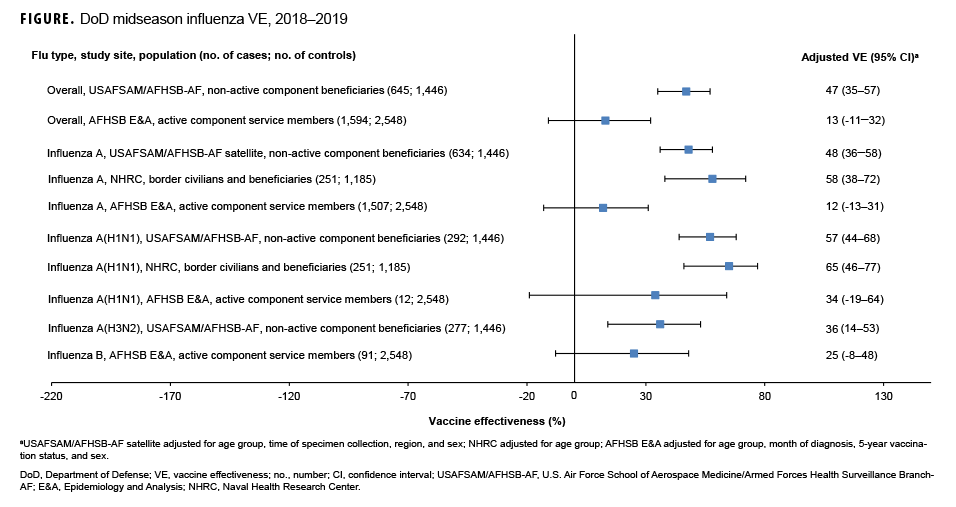
As shown in the Table and Figure, adjusted VE for all influenza types for non-active component MHS beneficiaries was 47% (95% CI: 35–57), indicating moderate protection against influenza infection. For active component service members, adjusted VE for all influenza types was low, at 13% (95% CI: -11–32). For all influenza A, adjusted VE for non-active component MHS beneficiaries was 48% (95% CI: 36–58), VE for U.S.–Mexico border population civilians and MHS beneficiaries was 58% (95% CI: 38–72), and VE for active component service members was 12% (95% CI: -13–31). For influenza A(H1N1), adjusted VE for non-active component MHS beneficiaries was 57% (95% CI: 44–68), VE for U.S.–Mexico border population civilians and MHS beneficiaries was 65% (95% CI: 46–77), and VE for active component service members was 34% (95% CI: -19–64). Influenza A(H3N2) was not detected in high enough proportions in most populations to calculate VE, but for non-active component MHS beneficiaries, adjusted VE was 36% (95% CI: 14–53), indicating low-to-moderate protection. Similarly, influenza B was not detected in high enough proportions in most populations early in the 2018–2019 season to calculate VE; however, for active component service members, adjusted VE was 25% (95% CI: -8–48), indicating low protection.
Editorial Comment
The DOD laboratories and partners conducting respiratory infection surveillance provide a valuable global perspective and capability. Monitoring global trends, particularly for influenza, provides situational awareness for DOD leaders and informs current and future operation risk assessments and recommendations for preventive measures. This surveillance also facilitates sample sharing and further collaboration with WHO and CDC.
In general, for civilian populations, influenza vaccination provided moderate protection against infection, and DOD-generated VE estimates of non-service member beneficiaries and select civilian populations were similar to CDC estimates for the same time frame. CDC reported that adjusted VE for all influenza types was 47%, adjusted VE for influenza A(H1N1) was 46%, and adjusted VE for influenza A(H3N2) was 44%.4 In CDC and DOD analyses, protection was greater for influenza A(H1N1) than influenza A(H3N2). However, for active component service members, adjusted VE estimates were much lower, though not statistically significant. This difference may be partially attributable to the requirement for annual influenza vaccination and the resulting high proportion of vaccination in this population. The effect is demonstrated by the case and control populations having nearly identical vaccination rates. The high vaccination rate makes it difficult to design a strong epidemiological study of VE in this population. Other factors, such as the requirement for service members to receive the vaccination annually, which may have biological effects such as attenuated immune response due to repeated exposures, may also impact the VE estimates. The timing of vaccination could also impact the VE estimates since service members typically receive the vaccine early in the influenza season or just before it starts. These factors should also be considered as potential contributors to the low VE estimates for the active component service members.
One important limitation of this study is potential non-differential misclassification of vaccination status due to poor recall on the self-reported questionnaire or documentation errors in the EHR. Also, the analyses did not assess vaccine impact on less severe cases of influenza since the VE estimates only include medically attended patients, and the populations studied are younger than the U.S. general population, which may reduce generalizability. More work, potentially using new methodologies, is needed to accurately estimate the vaccine's effect on reducing the influenza burden in active component service members and to determine the impact of repeat vaccinations on immune response to the vaccine or subsequent influenza exposures. Additional data and analyses in these areas would fill knowledge gaps and inform a more robust military influenza vaccination policy.
Author affiliations: Defense Health Agency, Armed Forces Health Surveillance Branch, Silver Spring, MD (Ms. Lynch, CDR Scheckelhoff, Dr. Eick-Cost, Ms. Hu, Ms. Johnson); General Dynamics Information Technology, Fairfax, VA (Ms. Lynch, Ms. Johnson); Defense Health Agency, Armed Forces Health Surveillance Branch-Air Force satellite, U.S. Air Force School of Aerospace Medicine, Wright-Patterson Air Force Base, OH (Mr. Coleman, Ms. DeMarcus, Lt Col Federinko); STS Systems Integration, LLC, San Antonio, TX (Mr. Coleman, Ms. DeMarcus); Cherokee Nation Technologies, Tulsa, OK (Dr. Eick-Cost, Ms. Hu); Naval Health Research Center, San Diego, CA (Mr.Hansen, LCDR Graf, Dr. Myers); Henry M. Jackson Foundation for the Advancement of Military Medicine, Bethesda, MD (Mr. Hansen)
Acknowledgments: The authors thank the Department of Defense Global Respiratory Pathogen Surveillance Program and its sentinel site partners, the Navy and Marine Corps Public Health Center, and the Centers for Disease Control and Prevention's Binational Border Infectious Disease Surveillance Program in San Diego and Imperial Counties, CA, which collected samples and case data from participating outpatient clinics.
Disclaimer: Authors include military service members or employees of the U.S. Government. This work was prepared as part of their official duties. Title 17, U.S.C. §105 provides that copyright protection under this title is not available for any work of the U.S. Government. Title 17, U.S.C. §101 defines a U.S. Government work as work prepared by a military service member or employee of the U.S. Government as part of that person's official duties.
Report No. 19-39 was supported by the Armed Forces Health Surveillance Branch's Global Emerging Infections Surveillance section under work unit no. 60805. The views expressed in this article are those of the authors and do not necessarily reflect the official policy or position of the Department of the Navy, Department of the Air Force, Department of Defense, or the U.S. Government.
The study protocol was approved by the Naval Health Research Center Institutional Review Board in compliance with all applicable Federal regulations governing the protection of human subjects. Research data were derived from an approved Naval Health Research Center Institutional Review Board protocol number NHRC.2007.0024.
References
- Sanchez JL, Cooper MJ, Myers CA, et al. Respiratory infections in the U.S. military: recent experience and control. Clin Microbiol Rev. 2015;28(3):743–800.
- Armed Forces Health Surveillance Branch. Absolute and relative morbidity burdens attributable to various illnesses and injuries, active component, U.S. Armed Forces, 2018. MSMR. 2019;26(5):2–10.
- Armed Forces Health Surveillance Branch. Ambulatory visits, active component, U.S. Armed Forces, 2018. MSMR. 2019;26(5):19–25.
- Doyle JD, Chung JR, Kim SS, et al. Interim estimates of 2018–19 seasonal influenza vaccine effectiveness–United States, Feb. 2019. MMWR Morb Mortal Wkly Rep. 2019;68(6)135–139.

