What Are the New Findings?
The Department of Defense (DOD) Hearing Conservation Program evaluation has historically been limited to service-specific metrics. This article presents the findings from the first review of data on the Measures of Effectiveness developed by the DOD Hearing Conservation Working Group.
What Is the Impact on Readiness and Force Health Protection?
Hazardous noise exposure is one of the most common occupational hazards within the DOD; such exposure can cause hearing loss or tinnitus that may directly affect a service member's ability to communicate effectively. The data presented here represent a means to evaluate the services' efforts at hearing s conservation.
Abstract
This article summarizes the findings from the first report of the new, standard Measures of Effectiveness developed by the DOD Hearing Conservation Program Working Group in 2018. When examining periodic hearing test results of DOD personnel, the overall risk of potential hearing injury/illness was stable from 2012 through 2018. The National Guard and Reserve components showed a higher potential risk of hearing loss, possibly related to lower compliance on follow-up tests when a shift in hearing occurred. Finally, the overall percentage of DOD personnel (who received periodic hearing tests) with hearing impairment decreased over the years presented.
Background
Starting in 1949 with the first U.S. Air Force (USAF) regulation on noise,1 Hearing Conservation Programs (HCPs) have been implemented within the military and most commercial occupational settings where hazardous noise is present. These programs protect individuals who are exposed to hazardous noise from developing noise-induced hearing loss or tinnitus, which may result in permanent disability and negatively affect quality of life.2 Basic components of an HCP to mitigate the negative effects of noise on the worker include noise exposure monitoring, engineering and administrative controls (e.g., reducing the noise at the source, limiting personnel work hours around a hazard), audiometric evaluation, use of hearing protection devices, education and motivation, record keeping, and program evaluation.3
The Occupational Safety and Health Administration (OSHA) directs that employers maintain an accurate record of all workers's noise exposures and audiometric testing information.4 Maintaining accurate and complete records provide evidence of compliance with regulations and are used to evaluate the effectiveness of the program.5 Due to the military's transient workforce, the DOD uses a system of records that allows for monitoring audiograms of service members and DOD civilian personnel at installations worldwide: the Defense Occupational and Environmental Health Readiness System - Hearing Conservation Data Repository (DOEHRS-HC DR). This system allows for capture, analysis, and storage of hearing test (audiograms) results worldwide for DOD HCPs.
Each DOD component establishes, maintains, and evaluates the effectiveness of its own HCP. At a minimum, hearing test results that document a significant threshold shift (STS) and a permanent threshold shift (PTS), as well as rates of compliance with requirements for hearing tests, are collected, reviewed by program managers, and reported to higher headquarters.6 However, because each service varies in how the metrics are gathered and reported, STS and PTS rates are not always standardized and thus not always comparable. For example, in the Army and Marines Corps, all service members receive hearing tests on at least an annual basis due to the risk of noise-induced hearing loss secondary to exposures to weapon fire noise during required weapon qualification.
Hearing ability is also considered an element of individual readiness due to the need to communicate effectively on the battlefield and its relationship to warfighter lethality and survivability. The Air Force and Navy hearing conservation programs take a risk-based approach in which only members who are exposed to routine hazardous noise are enrolled in an audiometric monitoring program and receive periodic hearing tests. To resolve discrepancies between services, the DOD Hearing Conservation Working Group (HCWG) agreed upon standard HCP Measures of Effectiveness (MOEs) in 2018. These MOEs were then prepared and codified by the U.S. Air Force School of Aerospace Medicine's Epidemiology Consult Service Division and the Armed Forces Health Surveillance Branch Air Force Satellite.
Methods
DOEHRS-HC DR data were used to generate MOEs at the DOD level and for each individual service. Data were stratified by component (active component [AC], National Guard [NG], reserve component, and civilian) and presented as annual percentages among those who were tested. This report presents findings for calendar years 2012 through 2018. All statistical analyses were performed using SAS/STAT software, version 9.4 (2014, SAS Institute, Cary, NC).
It is important to note that, if an individual's reference or periodic hearing test reveals a hearing threshold exceeding 25 decibels hearing level (dBHL) in either ear, then that individual is considered to suffer from hearing impairment. A reference test is the initial hearing test received by an individual before exposure to hazardous noise duty. A periodic test is the monitoring hearing test done regularly to detect changes in hearing that may be associated with hearing injury/illness. When compared to the reference test, changes in hearing in the periodic test may initially be characterized as a significant threshold shift (STS). An STS is an average deterioration in hearing threshold of 10 dBHL or more at 2000, 3000, and 4000 Hz in either ear on the monitoring test, when compared to the individual's reference test. When an STS occurs, follow-up testing is required to confirm whether the shift is temporary or permanent.7,8,9 If the STS has resolved at the time of the follow-up test, it is considered to have been a temporary threshold shift (TTS). Conversely, if an STS is confirmed on follow-up testing, or the member does not return for retesting within the specified timeframe, the STS is considered to represent a permanent threshold shift (PTS). The timeframe for follow-up testing varies from 30 to 90 days from the periodic test depending on service-specific regulations. Hearing is assessed at least annually for individuals and is compared to the most current reference test available. If an individual had more than one periodic or reference test series in a given calendar year, their most recent test series was used in the analysis. Aggregate data for 4 MOEs were compiled across all services and are described in this report.
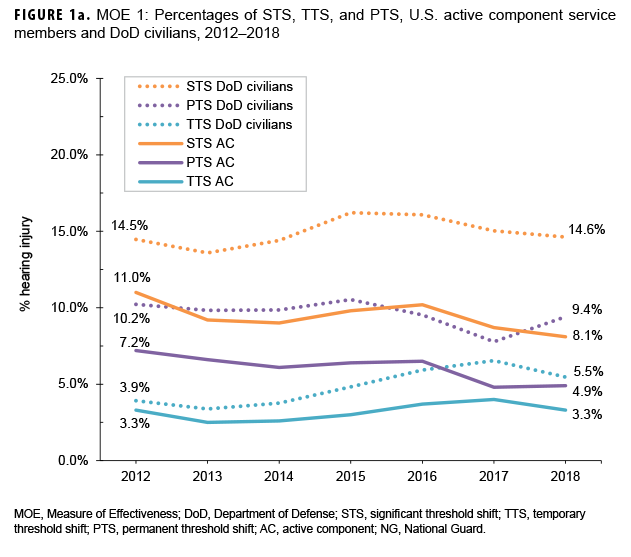
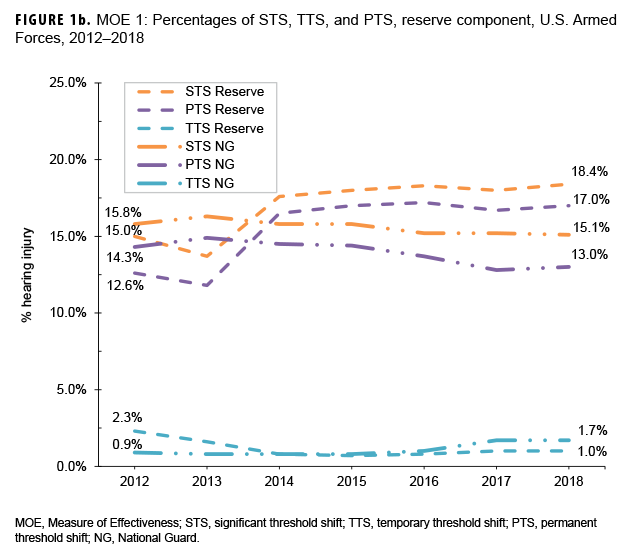
MOE 1 examines potential hearing illnesses/injuries by calculating the percentages of tested individuals who had results of STS, TTS, and PTS. The percentages of threshold shifts were calculated by taking the number of unique individuals meeting each set of respective criteria on an annual (a type of periodic test) hearing test per calendar year and dividing by the total number of individuals who received an annual hearing test. For example, the number of individuals with a PTS is divided by the number of those who received an annual hearing test in a given time frame and the result is expressed as a percentage.
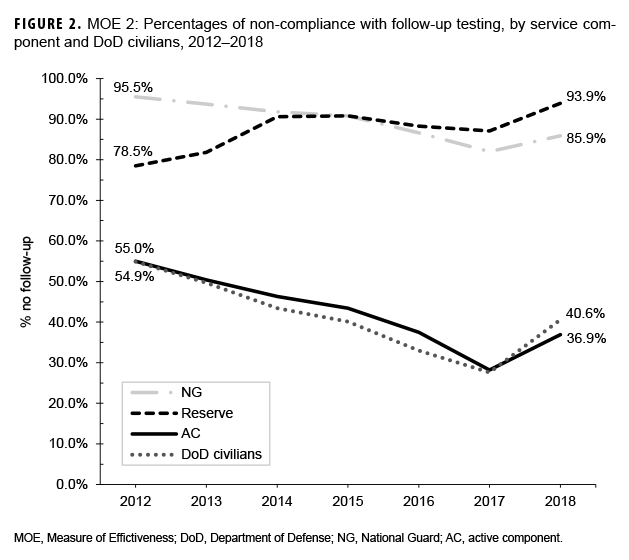
MOE 2 measures compliance with the requirement for follow-up testing after an STS. This MOE is similar to the DOD Instruction 6055.12 definition of compliance rates, but instead of measuring annual compliance with hearing tests,6 it measures non-compliance when follow-up is required. The rate of non-compliance is calculated by dividing the number of people with an STS who did not receive follow-up testing within the required time frame by the total number of tests indicative of STS per year. The time frame for follow-up testing is based on service-specific requirements.
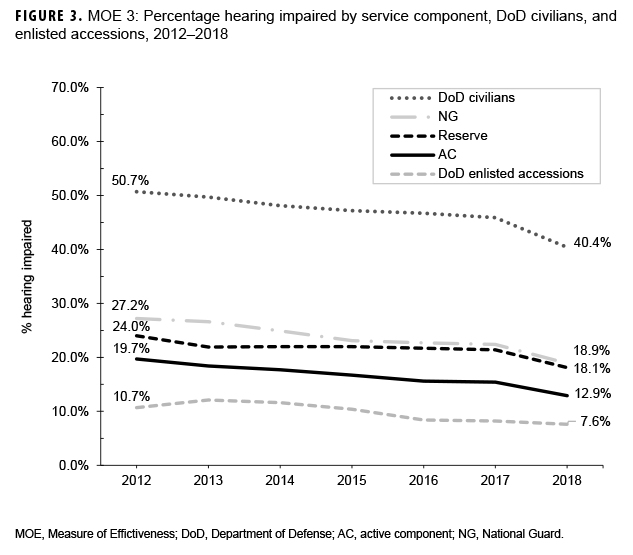
MOE 3 is a measure of the frequency of hearing impairment (hearing thresholds above 25 dBHL) or the frequency of those with clinically normal hearing (hearing thresholds at 25 dBHL or below) in a population of interest. In this report, MOE 3 focuses on the proportion of hearing impairment counts among individuals who received testing per year. Percentages of hearing impaired were calculated by taking the number of individuals (including enlisted accessions as a separate population) with hearing impairment results on a periodic or reference hearing test per year and dividing by the total number of individuals who received a periodic or reference hearing test in the same year.
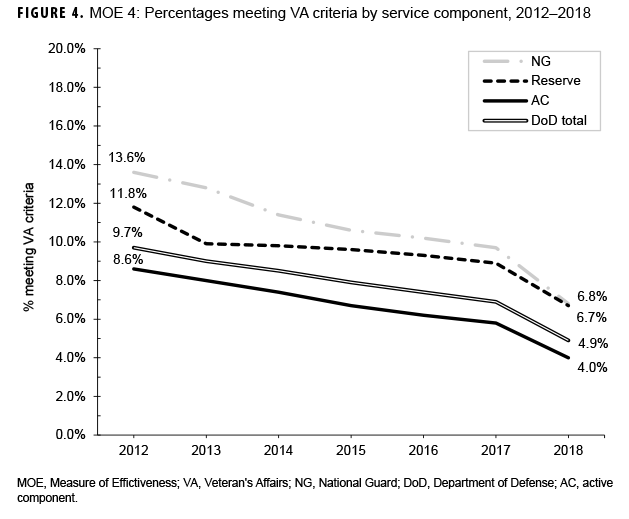
MOE 4 calculates the percentages of unique individuals who qualify for Veterans Affairs (VA) claims using counts and criteria as outlined in 38 CFR §3.385, Disability Due to Impaired Hearing.10 Service members meeting these criteria are deemed audiometrically eligible for service-connected disability for hearing impairment; however, there are multiple, additional criteria required before a disability rating for hearing loss is awarded by the VA. The audiometric criteria for MOE 4 are as follows: 1) any threshold greater than or equal to 40 dBHL from 500 to 4000 Hz in either ear, or 2) an average of the 3 highest frequencies between 500 to 4000 Hz greater than 25 dBHL (pure-tone average). The percentage of individuals meeting the VA compensation criteria was defined as the number who met the VA criteria per year divided by the total number of individuals who received a periodic or reference hearing test in that same year.
Results
Service representation in the data used for this analysis was approximately 60% Army, 14% Navy, 14% Marines, and 12% Air Force.11 Figures 1a and 1b show results for MOE 1. Overall, from 2012 through 2018, percentages of potential hearing injury/illness (MOE 1) exhibited a stable pattern or steady decline during the period for AC and civilians, and essentially a stable pattern for NG and reserve members after 2014. Annual percentages of STS and PTS were consistently higher in NG (STS range: 15.1 – 16.3%, PTS range: 12.8 – 14.9%) and reserve members (STS range: 13.7 – 18.4%, PTS range: 11.8 – 17.2%) when compared to AC members (STS range: 8.1 – 11.0%, PTS range: 4.8 – 7.2%). Over the course of the 7-year period, civilian percentages of STS (range: 13.6 – 16.2%) were broadly similar to that of reserve and NG members. Annual percentages of PTS in civilians (range: 9.4 – 10.5%) were higher than those among AC members, but lower than percentages among reserve and NG members (Figures 1a, 1b).
The frequency of non-compliance with follow-up testing (MOE 2) demonstrated a downward trend from 2012 through 2017 among AC, NG, and civilians. Overall, non-compliance among reserve members trended upward during the 7-year study period. In general, non-compliance was substantially lower among AC members (range: 28.2 – 55.0%) and civilians (range: 27.6 – 54.9%) when compared to reserve (range: 78.5 – 93.9%) and NG members (range: 82.0 – 95.5%) (Figure 2).
The percentages of those with hearing test results indicative of hearing impairment (MOE 3) decreased slightly but steadily from 2012 through 2018 for all service members and civilians (Figure 3). A stable, but slightly downward trend was also noted for DOD enlisted accessions. The percentages of those tested who met the VA compensation criteria (MOE 4) decreased steadily over the 7-year period for all components and the DOD overall (Figure 4). This downward trend appeared to occur equally across all service components.
Editorial Comment
MOE 1 results show that DOD civilian personnel have generally maintained a stable risk of hearing injury/illness from 2012 through 2018. The goal for this MOE was to detect potential hearing injuries/illnesses due to hazardous noise exposure; therefore, only the periodic annual tests were used to better reflect the personnel who are more routinely exposed. However, because only periodic annual tests were used in computing this measure, it is not recommended to compare MOE 1 STS, PTS, and/ or TTS outcomes to similar metrics found in DOEHRS-HC DR aggregate reports, or in other surveillance or research projects. Additionally, not all services are evenly represented within the DOEHRS-HC DR since each branch has its own criteria for enrolling members onto the program as previously stated.
Examination of MOE 1 results across components revealed that AC members had the lowest STS and PTS percentages, and the highest TTS percentages compared to reserve, and NG members. This trend in reserve and NG members may be the result of high non-compliance on follow-up tests as evident in the pattern of MOE 2 results. When an individual does not comply with the required follow-up test to verify a shift in hearing on the periodic annual hearing test within the required time frame, then a TTS automatically becomes a PTS in the DOERH-HC DR until the individual takes the next year's hearing test. Therefore, an accurate analysis of permanent hearing injury/illness in these 2 populations is not possible until the differences in the proportions of non-compliance are addressed.
The explanation for the elevated proportions of STS, TTS, and PTS among DOD civilian personnel is unknown; however, the results for this population may reflect differences in age and/or years of noise exposure compared to service member populations (as the effects of noise on the auditory system are cumulative over time), as well as non-compliance with follow- up testing when an STS is captured. Overall, the comparisons between these 4 groups should be undertaken with care due to the differences in their contributions to the dataset (AC 63%; reserve 12%; NG 18%; DoD civilian personnel 7%). In other words, although AC accounts for the largest percentage of test results represented in the DOEHRS-HC DR data, the rules of surveillance are quite different between services and in comparison to reserve, NG or DOD civilian populations. In addition, there are significant age and sex differences between the DOD civilian population and the other populations. Furthermore, there may be additional exposures for the reserves and NG; for example a traditional guardsman only on orders 1 weekend a month could have a concurrent full-time civilian position with hazardous noise exposure.
The trend seen in MOE 3 of fewer individuals presenting with a hearing impairment over the past 6 years could be the result of multiple factors, such as effective hearing conservation prevention efforts, employee turnover, a reduction in noise exposure due to an overall decrease in combat operations, and/or force reduction efforts (e.g., reduction in force by medical requirement enforcement, or decrease in waivers for hearing issues identified at accession). Additionally, the DOD civilian population had a higher percentage meeting the hearing impairment criteria. As with the MOE 1 results for civilians, this observation may have been due to differences in age and/or years of noise exposure for this population compared to service member populations. Alternatively, this trend could also have been the result of less comprehensive efforts in hearing conservation for non-military individuals within DOD. As the DOD continues to emphasize noise-induced hearing loss prevention and to monitor metrics like the MOEs, the downward trend of members meeting MOE 4 VA Criteria indicates fewer individuals are meeting audiometric hearing impairment criteria. There are additional criteria that need to be met before a final service-connected disability rating can be obtained for hearing loss such as speech recognition scores below a specified cut-off and medical professional concurrence.
A limitation of the DOEHRS-HC DR data, particularly for more recent years in this report, is the real-time nature of the system in which hearing tests are continuously being imported/exported, edited, and corrected at installations and service levels; decidedly, the data become more stable over time. Therefore, there is less confidence in some data trends until they are shown to be stable in subsequent years; MOE 3 and 4 results show recent shifts in their respective trends between 2017 and 2018, for example.
The MOEs methods and data sets will continually be reviewed by the DOD HCWG and adjusted as needed based on the ever changing mission sets and hazardous noise environments. Upon the request of the DOD HCWG, the Air Force Hearing Conservation Program Office at USAFSAM is evaluating early warning shifts (greater than or equal to 15dB shift at 1,000, 2,000, 3,000 or 4,000 Hz on periodic hearing tests compared to reference hearing test for an individual) for use as a more sensitive indicator for potential hearing injury/illness. These shifts are also flagged in the DOERHS-HC DR data and are very similar to the NIOSH recommended STS criteria.12 Preliminary data show that early warning shifts have a high positive predictive value in identifying those service members who will present with an STS on their periodic hearing test. Additionally, for the last several years, the Army has taken the STS reporting a step further by creating a "new case of STS" metric, due to the STS's dependence on follow-up test compliance. This metric only counts a new STS; it does not count a repeat STS that was noted the year before. A repeat STS can happen when the member does not complete the required follow up during the year prior; therefore, the reference was never re-established and the member presents with another shift. This metric helps the Army better understand the incidence of hearing injury and STS within their members. The addition of these 2 metrics could give the individual services the ability to better evaluate the effectiveness of their programs and make real-time recommendations, making these metrics good candidates for inclusion as an MOE in the future.
Author affiliations: U.S. Air Force School of Aerospace Medicine, Epidemiology Consult Service, Wright-Patterson AFB, OH (Mr. Wolff, Maj Batchelor, Dr. McKenna); U.S. Army Medical Material Development Activity, Warfighter Expeditionary Medicine and Treatment Project Management Office, Fort Detrick, MD (Maj Williams).
Acknowledgements: James D. Escobar, MPH; Deborah C. Lake, AuD; Theodore Mason; Joel R. Bealer, MA (CDR, USN); John A. Merkley, AuD (LTC, USA); Martin B. Robinette, AuD (LTC, USA).
References
- Department of the Air Force. Air Force Regulation No. 160-3. 31 Aug. 1949.
- American National Standards Institute (ANSI). ANSI Technical Report, Evaluating the Effectiveness of Hearing Conservation Programs through Audiometric Data Base Analysis. ANSI S12.13 TR- 2002 (R-2011).
- Centers for Disease Control and Prevention. In: Franks JR, Stephenson MR, Merry CJ, eds. Preventing Occupational Hearing Loss: A Practical Guide. Cincinnati, OH: National Institute for Occupational Safety and Health; 1996.
- Council for Accreditation in Occupational Hearing Conservation. In: Hutchison T, Schulz T, eds. Hearing Conservation Manual. 5th ed. Milwaukee, WI: Council for Accreditation in Occupational Hearing Conservation; 2014:13–18.
- Occupational Safety and Health Administration. 29 CFR 1910.95, Occupational noise exposure. 23 June 2008.
- Office of the Under Secretary of Defense for Personnel and Readiness. Department of Defense Instruction 6055.12. Hearing Conservation Program. 14 Aug. 2019.
- Office of the Secretary of the Air Force. Air Force Instruction 48-127. Occupational Noise and Hearing Conservation Program. 26 Feb. 2016.
- Headquarters, Department of the Army. Pamphlet 40-501. Army Hearing Program. 8 Jan. 2015.
- Navy and Marine Corps Public Health Center. Navy Medical Department Hearing Conservation Proram Procedures. TM 6260.51.99-2. 15 Sept. 2008.
- 38 CFR §3.385. Disability due to impaired hearing. 59 FR 60560. 25 Nov. 1994.
- DOD Hearing Conservation Working Group and DOD Hearing Center of Excellence. Hearing Health Surveillance Data Review Military Hearing Conservation–CY18. https://hearing.health.mil/Resources/ News-and-Events/Hearing-Health-Review. Accessed 01 Oct. 2019.
- National Institute for Occupational Safety and Health. Criteria for a Recommended Standard, Occupation Noise Exposure, Revised Criteria 1998. Publication No. 98-126. June 1998.