What Are the Findings?
This is the first MSMR report of the incidence of acute (AP) and chronic pancreatitis (CP) in the U.S. Armed Forces. Over the 15-year surveillance period, these relatively rare conditions were diagnosed in 6,471 and 893 active component service members, respectively. During the study period, approximately one-fifth (20.1%) of the incident AP cases experienced a recurrent attack of AP. A total of 581 (9.0%) of the AP cases received a subsequent incident diagnosis of CP during the study period.
What Is the Impact on Readiness and Force Health Protection?
AP and CP can significantly degrade the military operational capabilities of affected service members due to the various symptoms of the disorders. As a result, applicants for military service with a history of AP or CP are disqualified from service unless their AP was due to gallstones and was successfully treated by cholecystectomy. Furthermore, CP may result in long-term disability and predisposes patients to pancreatic cancer.
Abstract
Pancreatitis is an inflammatory disease of the pancreas resulting from the premature activation of digestive enzymes within the pancreas. Pancreatitis occurs in both acute and chronic forms. During 2004–2018, a total of 6,471 U.S. active component service members received incident diagnoses of acute pancreatitis (AP), for a crude overall incidence rate of 31.8 per 100,000 person-years (p-yrs). Compared to their respective counterparts, overall rates of AP diagnoses were highest among females, those in older age groups, non-Hispanic blacks, Army members, and those working in health care occupations. Crude annual rates of AP diagnoses increased by 25.5% over the 15-year period; this trend was driven largely by a rise in outpatient rates. Of the total incident cases of AP, 9.0% received a subsequent incident diagnosis of chronic pancreatitis (CP) during the surveillance period. Between 2004 and 2018, the crude overall incidence rate of CP was 4.4 per 100,000 p-yrs. Patterns of overall rates of CP by demographic and military characteristics were generally similar to those for AP. Crude annual rates of CP fluctuated between 3.7 per 100,000 p-yrs and 5.7 per 100,000 p-yrs during the surveillance period, with no pronounced overall trend over time. To inform preventive and therapeutic strategies, continued research is needed to understand the factors that increase risk of progression from AP to CP and the importance of the interaction between genetic and environmental factors in this transition.
Background
Pancreatitis is an inflammatory disease of the pancreas that causes significant morbidity and mortality worldwide.1 Located behind the stomach, the pancreas is a long, flat gland that secretes digestive enzymes into the small intestine and releases insulin to regulate blood glucose levels. Clusters of pancreatic acinar cells produce inactive precursors of digestive enzymes that are converted to active forms once they reach the small intestine.2 Pancreatitis results from the premature activation of digestive enzymes within the pancreas that leads to organ injury with or without subsequent destruction of the pancreatic acinar cell clusters.2
Pancreatitis occurs in acute and chronic forms. Acute pancreatitis (AP) is characterized by abdominal pain, nausea, vomiting, and elevated levels of pancreatic enzymes in the blood.2 The course of AP is highly variable. Although AP is self-limiting with supportive treatment in up to 80% of patients, it results in severe fulminant disease with extensive necrosis, systemic inflammation, and life-threatening multiorgan failure in a minority of cases.3,4 Gallstones and chronic alcohol abuse are the most common causes of AP.2,5 Gallstones account for an estimated 25 to 60% of AP cases in the U.S.6–9 Obstruction of the pancreatic duct by gallstones and the resultant collection of pancreatic fluid leads to an inflammatory response within the pancreas.2,4,10 In cases with a biliary etiology, recurrence of AP is prevented by cholecystectomy and removal of gallstones from the common bile duct.11
Approximately 25 to 35% of AP cases in the U.S. are attributable to long-term excessive alcohol consumption.6–9 Limiting alcohol consumption or total abstinence from alcohol after the onset of alcohol-related AP greatly reduces the risk of recurrences.11 Many of the damaging effects of alcohol on the pancreas are likely due to the direct effects of its toxic metabolites (e.g., acetaldehyde and fatty acid ethyl esters) on pancreatic cells.12 Alcohol also increases the permeability of pancreatic duct cells and alters pancreatic secretions by increasing their protein content and decreasing their bicarbonate levels.12 The conditions resulting from these changes can lead to the formation of protein plugs that block pancreatic outflow.12 However, many aspects of the mechanisms of pancreatic injury as well as the environmental (e.g., cigarette smoking) and genetic factors that affect the development of AP in heavy alcohol drinkers are not fully understood.5,12
Leading risk factors for AP include cigarette smoking,13 hypertriglyceridemia (triglyceride levels above 1,000 mg/dL),14,15some medications,16 having undergone endoscopic retrograde cholangiopancreatography (ERCP),17 and certain genetic risk profiles.18 The cause of AP is unknown in 10 to 30% of AP cases;9 however, results of several studies suggest that as many as two-thirds of idiopathic AP cases may be due to biliary microlithiasis.19–21 Other recent evidence indicates that the majority of idiopathic and recurring AP cases have underlying complex genetic risk profiles.22,23
AP is a leading gastrointestinal-related cause of hospitalization in the U.S. In 2014, AP accounted for over 275 thousand hospital admissions and nearly 1.3 million hospital bed days.24 In the U.S. general population, estimates of the incidence of AP range from approximately 40 to 124 per 100,000 persons, depending on the population studied, type of data used, and the methods employed to identify cases.25–27 Published data on the occurrence of AP among U.S. military personnel are sparse. One study of the incidence of AP among Military Health System beneficiaries hospitalized between 1 Oct. 2008 and 30 Sept.
Chronic pancreatitis (CP) is characterized by recurrent or persistent abdominal pain caused by progressive fibrosis of the pancreas and destruction of acinar and islet cells.29 Over the long-term, the progressive injury to the pancreas and surrounding structures generally results in loss of function.29 Evidence suggests that AP, recurring AP, and CP are on a continuum of related conditions with no clear-cut clinical transition points.30–32 The mechanisms of CP initiation and progression are complex and vary depending on underlying etiology, genetic risk profile, and environmental exposure.30–32 The majority of CP cases have more than 1 underlying cause; moreover, many aspects of the mechanisms by which the most common etiologies (i.e., heavy alcohol consumption5 and cigarette smoking13) cause CP remain unclear. The currently accepted view of CP pathophysiology holds that, following recurrent acute attacks, alcohol may trigger progression to chronic pancreatitis and pancreatic cancer.12 Such progression may occur as a result of the damaging effects of alcohol's metabolites on pancreatic cells; changes in cell signaling pathways; oxidative stress; activation of pancreatic stellate cells to produce fibrosis and the associated tissue damage; and other mechanisms.33 Smoking is an independent risk factor for both AP and CP and evidence indicates it has synergistic pathogenic effects with alcohol.5,12,25
Population-based estimates of the epidemiology of CP are highly variable as there are no universally accepted diagnostic criteria for this condition.27,30 However, limited evidence suggests that the incidence of CP in the U.S. general population ranges from 4 to 32 per 100,000 persons.25,26,34
AP and CP can significantly degrade the military operational capabilities of affected service members due to the various symptoms of the disorders. As a result, histories of AP, unless due to gallstones and successfully treated by cholecystectomy, and CP are disqualifying conditions for entrance into the U.S. military.35
This is the first MSMR article to report on the incidence rates of both AP and CP among U.S. active component service members. The current analysis describes the incidence of both forms of pancreatitis during 2004–2018 by demographic and military characteristics, examines the age of onset of both AP and CP, determines the median number of AP attacks per affected individual, and identifies the proportion of incident AP cases that progressed to CP.
Methods
The surveillance population consisted of all individuals who served in the active component of the U.S. Army, Navy, Air Force, or Marine Corps at any time between 1 Jan. 2004 and 31 Dec. 2018. Diagnoses were ascertained from administrative records of all inpatient and outpatient encounters of individuals who received medical care in fixed (i.e., not deployed or at sea) medical facilities of the Military Health System (MHS) or civilian facilities in the Click to closePurchased CareThe TRICARE Health Program is often referred to as purchased care. It is the services we “purchase” through the managed care support contracts.purchased care system documented in the Defense Medical Surveillance System (DMSS). In addition, diagnoses from health care encounters of deployed service members were ascertained from the Theater Medical Data Store (TMDS), which is incorporated into the DMSS.
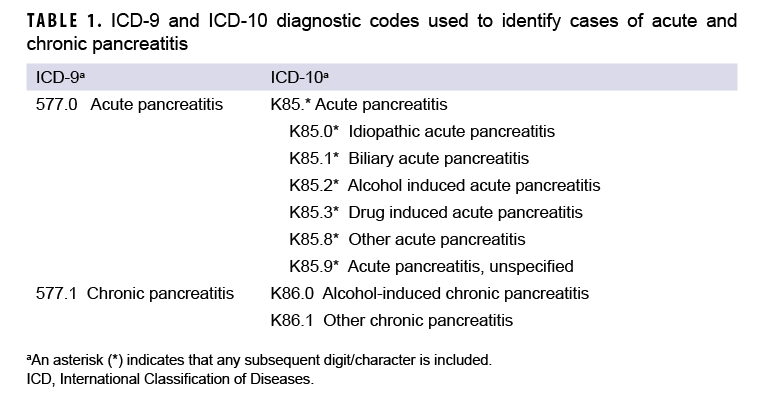
An incident case of AP was defined by having 1) a case-defining diagnosis (Table 1) in the first or second diagnostic position of at least 1 record of an inpatient medical encounter, or 2) two or more outpatient or TMDS medical encounters occurring within 90 days of each other (but not on the same day), with any of the defining diagnoses of AP in the first or second diagnostic position. The selection of the latter criterion was informed by the results of Xiao and colleagues’ recent meta-analytic examination of the diagnostic accuracy of various case definitions for identifying AP patients.27 Results of this study showed that the positive predictive value (PPV) associated with estimates of AP in studies using this criterion was higher (0.81) than that associated with studies that required the AP diagnosis appear in the primary diagnostic position (0.75).27 Cases of CP were defined by at least 1 inpatient or 2 or more outpatient or TMDS medical encounters within 12 months of each other, with any of the defining diagnoses of CP in the first or second diagnostic positions (Table 1). For the purposes of identifying incident AP and CP cases, TMDS records were treated as outpatient encounters.
The incidence date was the date of the first case-defining hospitalization or outpatient medical encounter that included a diagnosis of AP or CP. An individual could be counted as a case of AP or CP once per lifetime. An individual could be considered an incident case of AP and subsequently considered an incident case of CP. However, if a case-defining diagnosis of CP occurred first, the case could not be considered a case of AP at a later time. Prevalent cases (i.e., cases occurring before the start of the surveillance period) were excluded from the incidence analysis, and person-time was censored at the time of the incident case diagnosis. Incidence rates were calculated as incident AP or CP diagnoses per 100,000 person-years (p-yrs) of active component service. If a service member had more than 1 case-defining AP- or CP-related encounter on the same day, inpatient encounters were prioritized over outpatient encounters, which were prioritized over TMDS encounters.
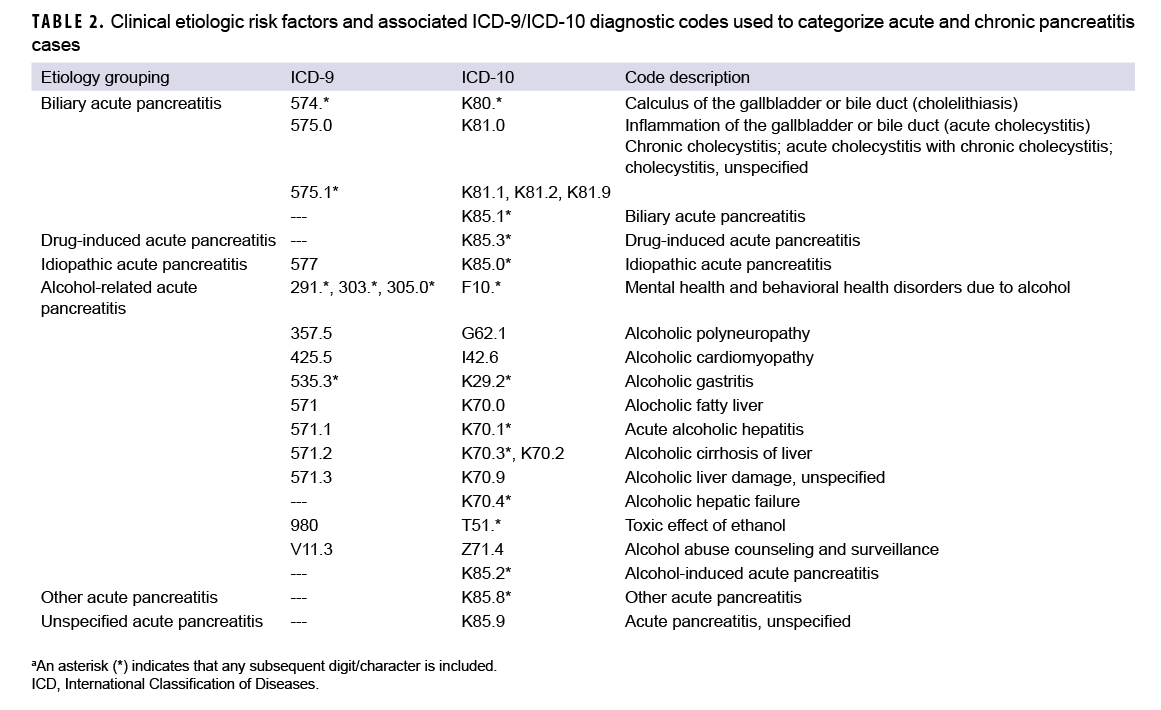
Consistent with published studies of AP incidence using data from electronic medical records, AP cases were classified by the presence of specific clinical etiologic risk factors.9,36 The number of etiologic categories for ICD-9-coded AP was limited to idiopathic and mixed etiology (classification as idiopathic plus either alcohol- or biliary-related). ICD-10-coded AP cases were classified into 7 categories including drug-induced, idiopathic, biliary, alcohol-induced, mixed etiology, other, and unspecified. The ICD diagnostic codes used to classify AP cases into these groupings are presented in Table 2. Incident CP cases were classified by diagnosis code into 2 categories—alcohol-induced CP or other CP (Table 1).
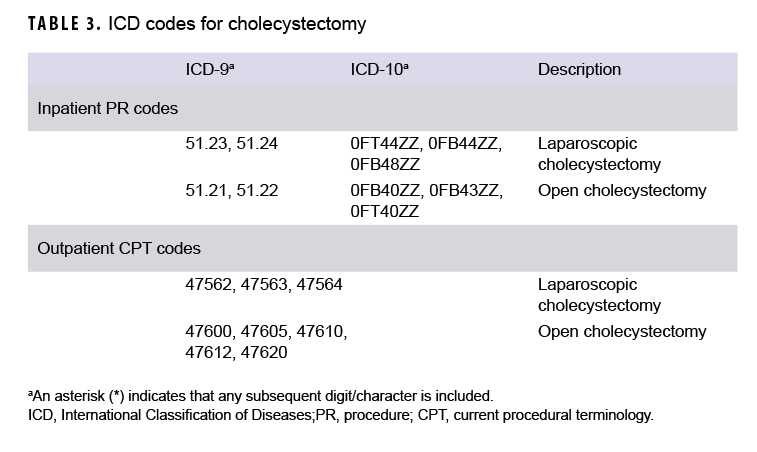
Median age at the time of case-defining diagnosis of AP was computed overall, by sex, and by race/ethnicity group. In addition, the number and percentage of total incident AP cases who underwent cholecystectomy after their incident diagnosis of AP was determined. An incident AP case was considered to have undergone a cholecystectomy if there was an inpatient encounter with a procedure code (PR code) for cholecystectomy in any position or an outpatient encounter with a Current Procedural Terminology (CPT) code for cholecystectomy in any position (Table 3)
Because AP is often characterized by later attacks that each require medical attention, the number of AP attacks during the surveillance period was determined. The incident AP diagnosis counted as 1 attack. A subsequent AP attack was defined as having an inpatient, outpatient, or TMDS encounter with the ICD-9 diagnosis code 577.0 or ICD-10 code K85.* recorded in the first or second diagnostic position. A subsequent attack was counted once every 90 days following the incident AP diagnosis.
Among those AP cases with subsequent case-defining CP diagnoses during the surveillance period, the time between the incident AP diagnosis and the first CP diagnosis was calculated. Finally, the total numbers of inpatient and outpatient encounters with a case-defining AP diagnosis in the first diagnostic position (incident and prevalent cases) and the total number of unique individuals affected were computed for the 2018 calendar year. For the number of encounters, only 1 encounter was counted per individual per day. The number of individuals affected by AP was the number of unique service members with at least 1 inpatient, outpatient, or TMDS encounter with an AP diagnosis in the first diagnostic position during 2018. The same procedures were employed to determine the total number of medical encounters for and total number of unique individuals affected by CP in 2018.
Results
Acute pancreatitis
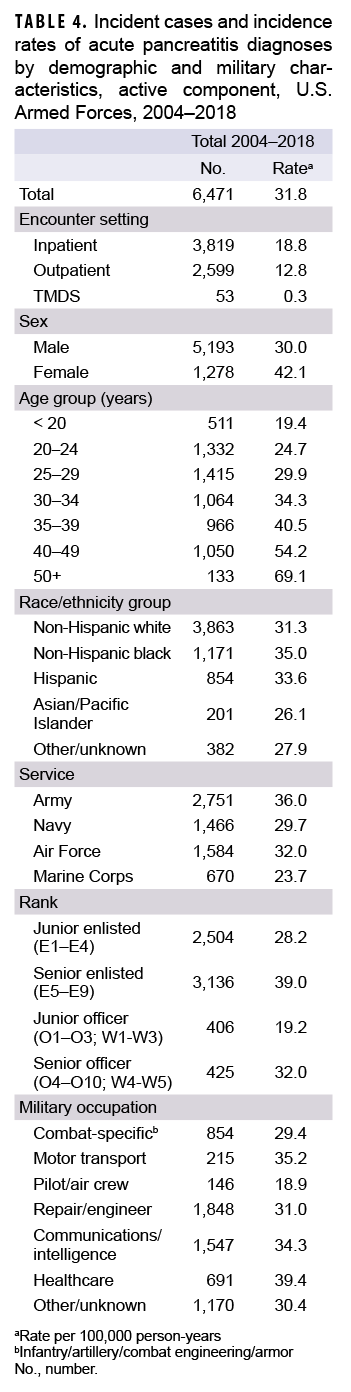
Between 2004 and 2018, a total of 6,471 active component service members received incident diagnoses of AP, for a crude overall incidence rate of 31.8 per 100,000 p-yrs (Table 4). Nearly three fifths (59.0%; n=3,819) of the incident AP diagnoses were recorded in an inpatient setting; 40.2% (n=2,599) were recorded in an outpatient setting; and less than 1% (n=53) were associated with TMDS encounters (Table 4).
The overall crude rate of incident AP diagnoses among women was 1.4 times that among men (42.1 per 100,000 p-yrs and 30.0 per 100,000 p-yrs, respectively). Overall rates of AP diagnoses increased with increasing age, with the rate among service members 50 years of age or older more than 3 times that among those in the youngest age group (less than 20 years) (Table 4). Non-Hispanic black service members had the highest crude overall rate of incident AP diagnoses (35.0 per 100,000 p-yrs) compared to those in other race/ethnicity groups. The lowest overall rate by race/ethnicity group was observed among Asian/Pacific Islander service members (26.1 per 100,000 p-yrs). Across the services, overall incidence rates of AP diagnoses were highest among Army members (36.0 per 100,000 p-yrs) and lowest among Marine Corps members (23.7 per 100,000 p-yrs) (Table 4). The overall rates of incident AP diagnoses among junior enlisted service members and junior officers were lower than those among their respective senior counterparts. The overall rate of incident AP diagnoses was highest among those working in health care occupations (39.4 per 100,000 p-yrs) and lowest among pilots/air crew (18.9 per 100,000 p-yrs).
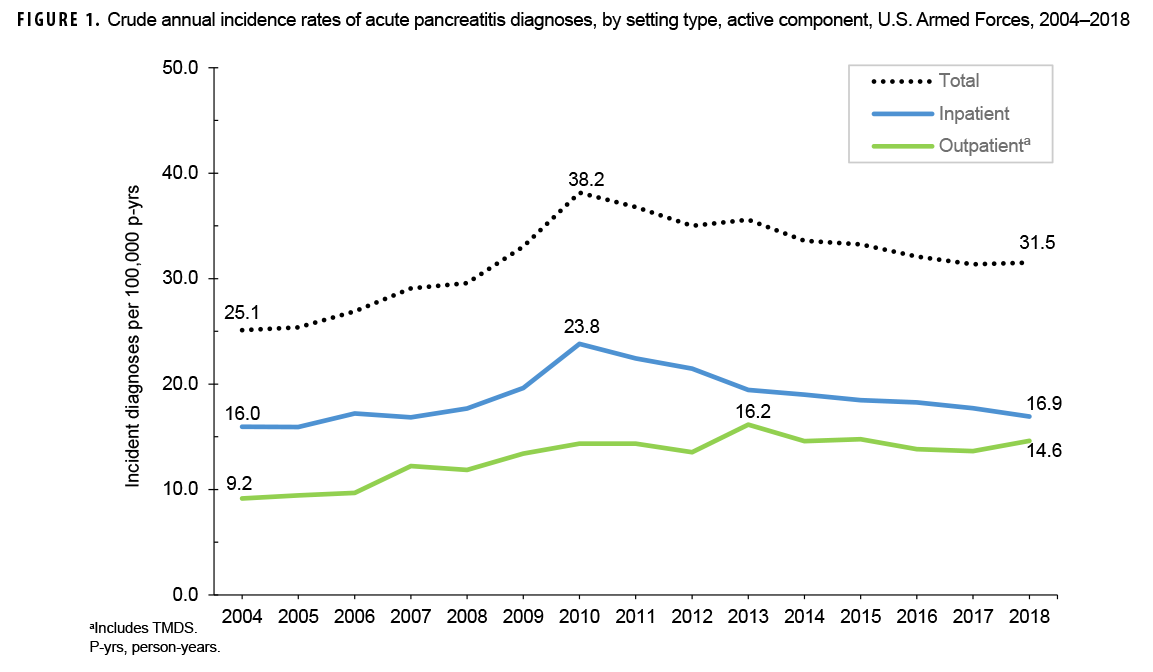
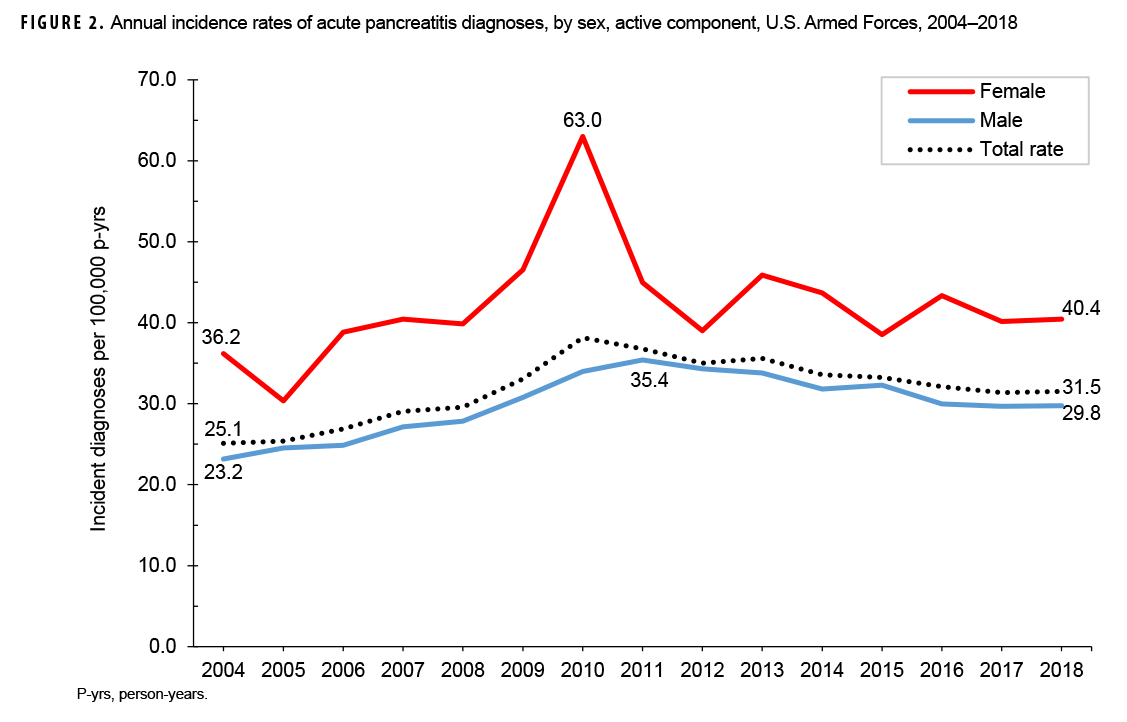
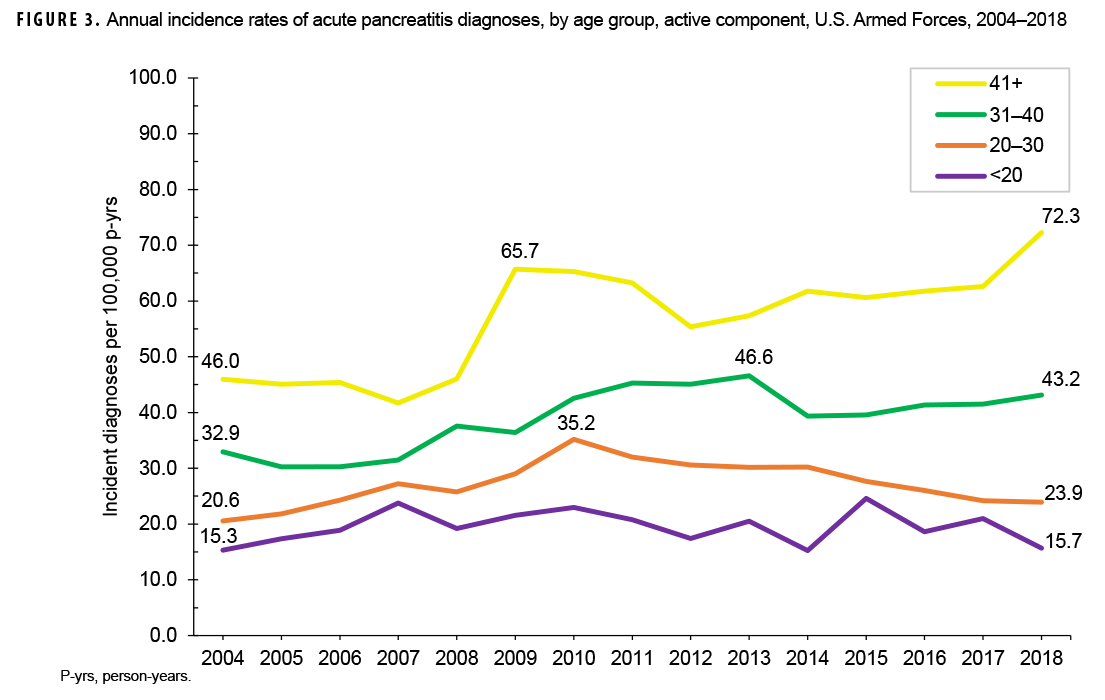
Crude annual incidence rates of AP increased from 25.1 per 100,000 p-yrs in 2004 to a peak of 38.2 per 100,000 p-yrs in 2010 after which rates decreased to 31.5 per 100,000 p-yrs in 2018 (Figure 1). The 2010 peak in annual rates was reflected in the pattern of inpatient rates of AP over time. Over the course of the surveillance period, annual rates of incident AP diagnoses increased 25.5%. This change in AP rates was driven largely by a rise in outpatient rates which increased from 9.2 per 100,000 p-yrs in 2004 to 14.6 per 100,000 p-yrs in 2018 (59.6%). Throughout the 15-year period, annual rates of AP among active component service women were consistently higher than those among service men (Figure 2). Rates among service women showed a marked increase in 2010, peaking at 63.0 per 100,000 p-yrs and then declining to 39.0 per 100,000 p-yrs in 2012. From 2013 onward, rates fluctuated between 38.6 per 100,000 p-yrs and 45.9 per 100,000 p-yrs. Rates among service men increased gradually from 23.2 per 100,000 p-yrs in 2004 to a peak of 35.4 per 100,000 p-yrs in 2011, after which rates declined slightly to 29.8 per 100,000 p-yrs in 2018. Examination of annual rates of incident AP diagnoses by age group showed that rates increased over time in the 2 oldest age groups, those 41 years of age or older and those aged 31–40 years (Figure 3). Annual rates of incident AP diagnoses among those aged 20–30 years increased from 20.6 per 100,000 p-yrs in 2004 to 35.2 per 100,000 p-yrs in 2010 and then decreased to 23.9 per 100,000 p-yrs in 2018. During 2004–2018, annual rates were comparatively stable among service members under 20 years old; however, the annual numbers of cases were relatively small in this age group. No pronounced patterns in annual rates over time were evident by race/ethnicity group or by service.
As expected, given the 15-year span of the surveillance period, the majority (79.6%; n=5,149) of the incident AP diagnoses were coded with ICD-9 diagnostic codes (data not shown). Of those AP cases with ICD-9 coding, slightly more than half (55.4%) were categorized as idiopathic AP and the remainder as AP of mixed etiology (idiopathic with biliary- or alcohol-related etiology) (data not shown). Of the 1,322 incident AP diagnoses with ICD-10 coding, more than a third (37.5%) were classified as AP unspecified, followed by 23.5% classified as alcohol-induced, 19.6% as biliary, 7.4% as idiopathic AP, 7.3% as AP of mixed etiology, 3.4% as other AP, and 1.3% as drug-induced AP (data not shown). A total of 1,149 incident AP cases (17.8%) underwent a subsequent cholecystectomy during the surveillance period (data not shown).
Overall, the median age at case-defining AP diagnosis was 29 years (interquartile range [IQR]=24–37) (data not shown). Female AP cases had a younger median age at incident AP diagnosis than their male counterparts (27 years, IQR=23–34 and 30 years, IQR=24–38, respectively) (data not shown). Crude comparisons of age at incident AP diagnosis by race/ethnicity group showed that Hispanics and those in the other/unknown race/ethnicity group had the youngest median ages at diagnosis (28 years, IQR=23–35 and 28 years, IQR=24–36, respectively), while Asian Pacific/Islanders and non-Hispanic blacks had the oldest median ages at diagnosis (32 years, IQR=26–39 and 32 years, IQR=25–38, respectively) (data not shown).
Approximately four fifths (79.9%) of the incident cases had a single attack of AP during the surveillance period with the remaining 20.1% having had multiple attacks of AP (data not shown). Incident cases with multiple AP attacks experienced an average of 3 attacks (median=2, IQR 2–3) during the 15-year surveillance period. Of the 6,471 total incident cases of AP, 581 (9.0%) received a subsequent incident diagnosis of CP during the surveillance period (data not shown); among these cases, the median time between incident AP diagnosis and incident CP diagnosis was 4.6 months (IQR=1.2–16.7) (mean=12.7 months) (data not shown).
Among active component service members in 2018, a total of 661 unique individuals (incident and prevalent cases) were affected by AP(data not shown). These individuals contributed a total of 2,645 AP-related medical encounters, representing 4 medical encounters per affected individual. Slightly more than one-eighth (13.8%) of the total AP-related medical encounters in 2018 were in an inpatient setting with the remainder in an outpatient setting (85.6%) or recorded in TMDS (0.6%). In 2018, service members affected by AP who had 1 or more AP-related hospitalizations (n=297) contributed a total of 1,572 hospital bed days (data not shown).
Chronic pancreatitis
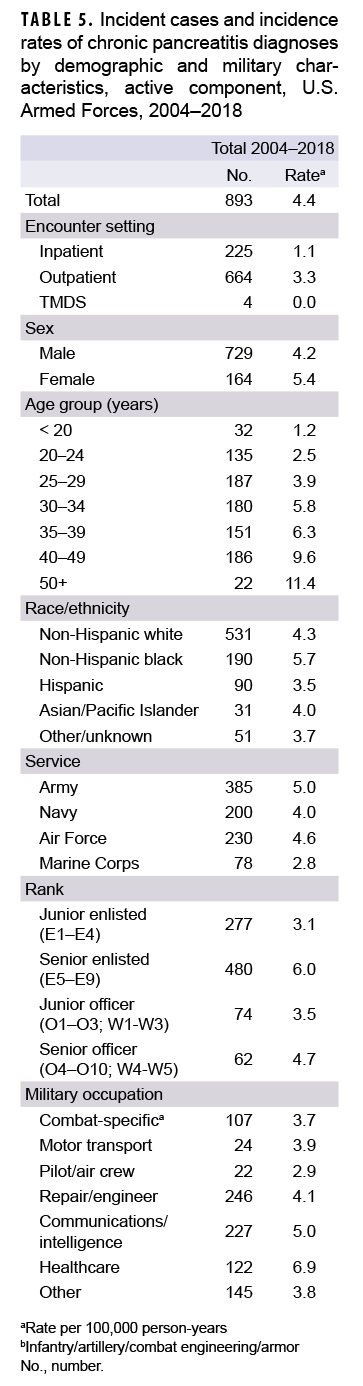
During 2004–2018, a total of 893 active component service members received incident diagnoses of CP, for a crude overall incidence rate of 4.4 per 100,000 p-yrs (Table 5). Nearly three quarters (74.4%; n=664) of the incident CP diagnoses were recorded in an outpatient setting; approximately one quarter (25.2%; n=225) were recorded in an inpatient setting; and less than 1% (n=4) were associated with TMDS encounters.
Compared to their respective counterparts, the overall rates of incident CP diagnoses were highest among women (5.4 per 100,000 p-yrs), senior enlisted service members (6.0 per 100,000 p-yrs), and those working in health care occupations (6.9 per 100,000 p-yrs) (Table 5). Overall incidence rates of CP increased with increasing age, with service members aged 50 years or older having an overall rate more than 4 times that of those aged 24 years or younger. Across race/ethnicity groups, the highest overall rate was among non-Hispanic black service members (5.7 per 100,000 p-yrs) and the lowest among Hispanic service members (3.5 per 100,000 p-yrs). The overall rate of CP among Army members was 1.8 times that of Marine Corps members (5.0 per 100,000 p-yrs and 2.8 per 100,000 p-yrs, respectively).
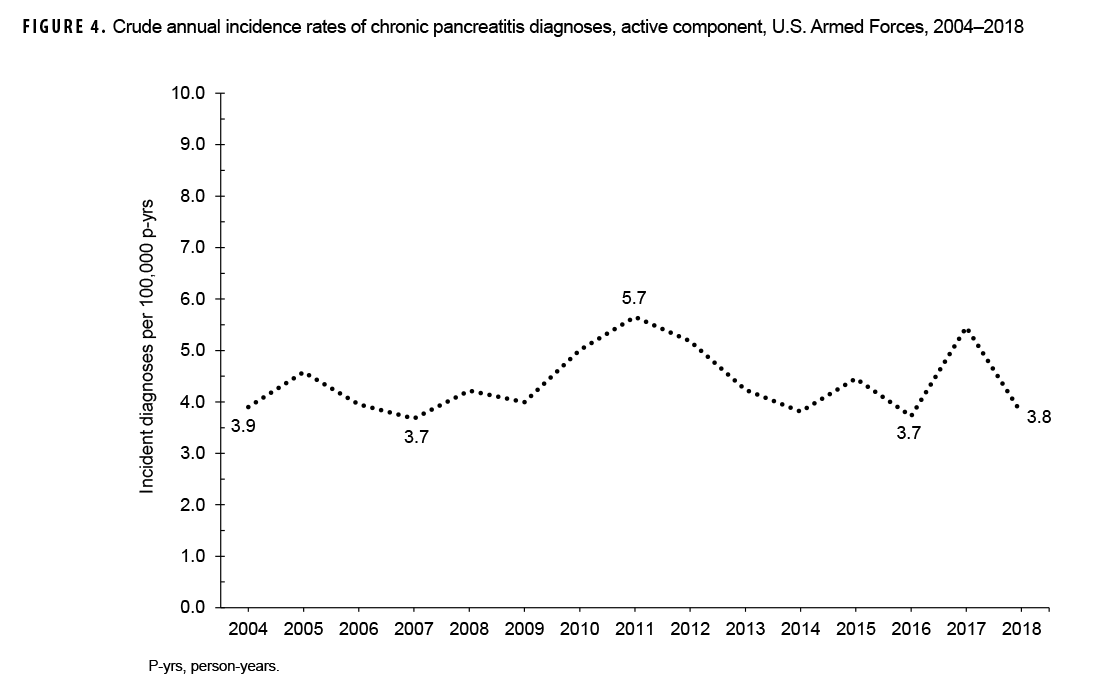
During the 15-year surveillance period, crude annual incidence rates of CP fluctuated between 3.7 per 100,000 p-yrs and 5.7 per 100,000 p-yrs with no pronounced overall trend over time (Figure 4). Low case counts precluded the examination of annual incidence rates of CP diagnoses by demographic or military characteristics.
Of the total incident cases of CP, 36.1% had a case-defining diagnosis of alcohol-induced CP and 63.9% had a case-defining diagnosis of other (data not shown). The median age at case-defining CP diagnosis was 32 years (IQR=26–39) (data not shown). Examination of the age at incident CP diagnosis by sex showed that men had a higher median age at diagnosis than women (33 years, IQR=27–40 and 29 years, IQR=24–34, respectively) (data not shown). Crude comparisons of age at incident CP diagnosis by race/ethnicity group showed that non-Hispanic black service members had the oldest median age at diagnosis (35 years, IQR=28–41), while Asian/Pacific Islanders had the youngest (30 years, IQR=26–39) (data not shown).
Among active component service members in 2018, a total of 129 unique individuals (incident and prevalent cases) were affected by CP (data not shown). These individuals contributed a total of 445 CP-related medical encounters, representing about 3 medical encounters per affected individual. The vast majority (96.2%) of total CP-related medical encounters in 2018 were in outpatient settings with the remainder in inpatient settings (3.1%) or recorded in TMDS (0.7%).
Editorial Comment
This study showed that the crude annual incidence rates of AP diagnoses increased by 25.5% over the course of the 15-year surveillance period; this trend was driven largely by a rise in outpatient rates. To date, only 1 published U.S. study of adult AP incidence rates over time has used data from records of both hospitalizations and ambulatory visits. In their analysis of commercial inpatient and outpatient insurance claims from 2007 through 2014, Sellers and colleagues found that adult AP incidence rates decreased from 123.7 per 100,000 persons in 2007 to 111.2 per 100,000 persons in 2014.26These estimates are 3 to 4 times higher than what was observed in the current study during a comparable time period. This difference is likely due, at least in part, to differences in the case definitions used (Sellers et al. identified case-defining ICD-9 codes in the first 4 diagnostic positions) and the demographic characteristics of the populations examined (Sellers et al. study population included more older adults [50+ years]).26 However, the AP incidence estimate from Cunningham and colleagues' study of hospitalized Military Health System beneficiaries (25 per 100,000 persons) and the inpatient rate of incident AP diagnoses during a comparable time period from the current study (range 19.6–23.8 per 100,000 p-yrs) are relatively close in value.28
The crude overall rate of incident AP diagnoses increased with increasing age and was higher among females than males. Age and sex distributions of AP are known to differ by etiology.25 The risk of AP increases progressively with age in both sexes, driven primarily by increasing incidence of biliary and idiopathic AP with increasing age.25 The current findings by sex are in line with other studies of large administrative databases and may be explained, at least in part, by the fact that risk of biliary AP is higher in women, consistent with the demographic risk of gallstones. 9,25,26 Compared to their respective counterparts, non-Hispanic blacks had the highest overall incidence rate of AP. The risk of hospitalization for AP in black patients has been reported to be 2–3 times greater than that of whites.7,37–39 Moreover, compared to white patients, black patients are noted to have a greater risk of readmissions after an initial episode of AP.40 Little is known about the reasons for the racial disparity in AP risk. Further research is needed to determine whether the observed differences result from dietary, lifestyle, genetic, or other factors.25 Overall rates were highest among those in health care occupations and lowest among pilots and air crew. This finding warrants further analysis to examine adjusted (e.g., age. sex, race/ethnicity group) incidence rates among service members within these occupational categories.
Crude comparisons of the median age at incident AP diagnosis showed that service women had a younger median age at onset than service men. Evidence indicates that median age at onset of AP varies by etiology, with alcohol-related AP tending to have a younger age at onset compared to biliary AP.25 Across race/ethnicity groups, Hispanics and those in the other/unknown race/ethnicity group had the youngest median ages at AP diagnosis while Asian Pacific/Islanders and non-Hispanic blacks had the oldest median ages at diagnosis. However, these differences by race/ethnicity could be due, at least in part, to underlying differences in the age distributions of the groups.
In the current study, one-fifth (20.1%) of the incident AP cases experienced multiple AP attacks during the surveillance period. This finding is consistent with the results of a recent meta-analysis that reported a pooled prevalence of AP recurrence of 22% (95% CI: 18%–26%).30 A similar estimate (22%) for the rate of readmission for primary diagnosis of AP was obtained by Yadav and colleagues using administrative information from the Pennsylvania Health Care Cost Containment Council (PHC4) dataset for the period from 1996 through 2005.39
Of the total incident cases of AP identified in the current study, 9.0% received a subsequent incident diagnosis of CP during the surveillance period. This percentage is similar to the pooled prevalence of CP in patients after their initial episode of AP reported by Sankaran et al. (10%; 95% CI: 6%–15%).30In their analysis of commercial inpatient and outpatient insurance claims from 2007 through 2014, Sellers and colleagues reported that 14.3% of incident AP cases went on to have a diagnosis of CP during the study period.26
Among the AP cases who later had a subsequent incident CP diagnosis during the surveillance period, the median time between incident AP diagnosis and incident CP diagnosis was 4.6 months (mean=12.7 months). From their study using PHC4 data, Yadav and colleagues reported a median duration from incident AP diagnosis to subsequent CP diagnosis of 10.4 months (IQR=2.6–28.9).39 However, median duration of progression differed significantly by etiology, with the longest duration for alcoholic AP (14.8 months; IQR=4.3–37.8) and the shortest for biliary AP (3.7 months; IQR=0.7–16.9).39 The rapid progression from AP to CP observed in the current study could suggest that existing CP may have initially been misdiagnosed as AP. The quanitification of CP cases may be obscured by the continuum of disease between recurring AP and CP.
The current study documented that crude annual incidence rates of CP fluctuated between 3.7 per 100,000 p-yrs and 5.7 per 100,000 p-yrs during the 15-year surveillance period, with no pronounced overall trend over time. Sellers and colleagues' estimates of CP incidence decreased from 31.7 per 100,000 persons in 2007 to 24.7 per 100,000 persons in 2014.26 As with the marked difference between Sellers et al.'s estimates of AP incidence and those of the current analysis, the difference in CP incidence estimates is likely attributable, at least in part, to differences in the case definitions used and the demographic characteristics of the populations examined. Of the few published U.S. estimates of CP incidence to date, the crude overall inpatient rate of CP observed in the current study (1.1 per 100,000 p-yrs) is most similar to the crude inpatient rate of CP reported by Yadav et al. for the period from 1997 through 2006 (3.95 per 100,000 persons).34
Patterns of overall incidence of CP diagnoses were similar to those observed for AP in terms of age, sex, race/ethnicity, and military characteristics. The differences in overall CP incidence rates by age and race/ethnicity group are consistent with known data.37,38 One recent study of patients with CP prospectively enrolled from 26 U.S. centers during 2000–2014 demonstrated, that when compared with whites, black patients were almost twice as likely to receive a CP diagnosis due to alcohol and/or cigarette smoking and more likely to have a greater degree of disease-related disability.37 Further research is needed to establish whether any greater genetic susceptibility to alcohol- and/or tobacco-induced disease and other features of CP is present based upon race/ethnicity.
Most previous U.S. studies of the occurrence of AP over time have relied solely on inpatient databases.9,34,36,41,42Hospital admission with AP is common given concerns about worsening course of illness even in initially mild AP cases and a lack of established home management practices/approaches. Also, when "nothing by mouth" was the main treatment for AP, hospital admission was necessary. However, with the current use of early enteral feeding, patients with mild AP who can tolerate oral hydration and pain control may be managed in an outpatient setting.3 Thus, estimates of AP and CP based only on inpatient records do not completely capture all individuals with these conditions. This disparity may be even more pronounced for CP, where the management of chronic pain and nutrition primarily occurs in an outpatient setting.26 An important strength of the current study is that it drew on records of inpatient and outpatient encounters, likely resulting in increased accuracy of estimates of AP and CP incidence rates.
There are several limitations that should be considered when interpreting the results of the current analysis. First, miscoding may have led to miscategorization of some AP and CP cases. Recent studies have noted high variability in the reported PPV of diagnostic coding in AP and CP.27,43,44 In their systematic review and meta-analysis of pancreatitis-focused diagnostic accuracy studies, Xiao and colleagues found that the pooled PPVs for AP and CP were 0.7127; that is, 71% of cases identified in the administrative data were likely true cases of AP or CP. It is important to note that these authors reported a PPV of 0.81 for studies that employed a case definition that included qualifying diagnoses in the first or second diagnostic position, as was done in the current analysis. Xiao and colleagues posited that the main clinical implication of the generally moderate PPVs of AP and CP (0.71) is that pancreatitis may be frequently overdiagnosed.27 However, results of subgroup analyses by version of ICD showed that ICD-10 codes yielded a 10% higher PPV than that of ICD-9 codes.27 This improvement in accuracy is partly attributable to improvements in diagnostic methods.45 Also, ICD-10 coding requires classification by etiology, which would likely require more confidence in the diagnosis.46 In the current analysis, the etiology of AP could not be appropriately categorized based on ICD-9 coding alone.
Another limitation of this study is that diagnoses that occurred after a service member left service, or were paid for out of pocket, were not captured. Finally, medical data from sites that were using the new electronic health record for the Military Health System, MHS GENESIS, during 2017–2018 are not available in the DMSS. These sites include Naval Hospital Oak Harbor, Naval Hospital Bremerton, Air Force Medical Services Fairchild, and Madigan Army Medical Center. Therefore, medical encounter data for individuals seeking care at any of these facilities during 2017–2018 were not included in the current analysis.
As one of the only published studies of AP and CP incidence among U.S. active component service members, this study makes a useful contribution to the literature on temporal changes in the occurrence of these conditions in this population. Observed differences in overall incidence rates of AP and CP by race/ethnicity group and military occupation warrant further analysis to examine adjusted (e.g., by age, sex) incidence rates among service members within these groups. Results indicating that non-Hispanic blacks have higher incidence of AP and CP than non-Hispanic whites are consistent with recent civilian literature and highlight the importance of studying a racially and ethnically diverse population as findings may lead to important insights into the etiology and prognosis of both forms of the disease.
The current analysis identified 6,471 incident cases of AP among active component service members over a 15-year surveillance period. Factoring in the estimated PPV of the case definition employed in this study, about 1,230 of these cases may not have been true cases. Also, approximately four-fifths of the incident cases did not experience a recurrent attack of AP during the study period. However, any episode of AP experienced by a service member can result in significant periods of limited duty. The occurrence of CP reduces quality of life due to pain and inadequate digestion, may result in long-term disability, and predisposes patients to pancreatic cancer.25 Furthermore, the management of AP and CP and their complications may impose considerable economic burden on the MHS. In the U.S. in 2014, AP and CP were associated with an estimated $2.7 billion dollars in direct costs, with hospital inpatient stays accounting for the majority of these costs.24 To inform preventive and therapeutic strategies, continued research is needed to understand the factors that increase risk of progression from AP to CP and the importance of the interaction between genetic and environmental factors in this transition.
References
- Lankisch PG, Minoti A, Banks PA. Acute pancreatitis. Lancet. 2015;386(9988):85–96.
- Aghani E. Acute pancreatitis. Pancreapedia:Exocrine Pancreas Knowledge Base. https://pancreapedia.org/?q=node/8823. Accessed 18 Feb. 2020.
- Phillip V, Steiner JM, Algül H. Early phase of acute pancreatitis: assessment and management. World J Gastrointest Pathophysiol. 2014;5(3):158–168.
- Whitcomb DC. Clinical practice. Acute pancreatitis. N Engl J Med. 2006;354(20):2142–2150.
- Yadav D. Reassessing the risk of pancreatitis with alcohol. Pancreas. 2016;45(6):781–782.
- Spanier BW, Dijkgraaf MG, Bruno MJ. Epidemiology, aetiology and outcome of acute and chronic pancreatitis: an update. Best Pract Res Clin Gastroenterol. 2008;22(1):45–63.
- Yang AL, Vadhavkar S, Singh G, Omary MB. Epidemiology of alcohol-related liver and pancreatic disease in the United States. Arch Intern Med. 2008;168(6):649–656.
- Whitcomb DC, Yadav D, Adam S, et al. for the North American Pancreatic Study Group. Multicenter approach to recurrent acute and chronic pancreatitis in the United States: the North American Pancreatitis Study 2 (NAPS2). Pancreatology. 2008. 8(4–5):520–531.
- Chen Y, Zak Y, Hernandez-Boussard T, Park W, Visser BC. The epidemiology of idiopathic acute pancreatitis, analysis of the Nationwide Inpatient Sample from 1998 to 2007. Pancreas. 2013;42(1):1–5.
- Lerch MM, Weidenbach H, Hernandez CA, Preclik G, Adler G. Pancreatic outflow obstruction as the critical event for human gall stone induced pancreatitis. Gut. 1994;35(10):1501–1503.
- Nordback I, Pelli H, Lappalainen-Lehto R, et al. The recurrence of acute alcohol-associated pancreatitis can be reduced: a randomized controlled trial. Gastroenterology. 2009;136(3):848–855.
- Setiawan VW, Monroe K, Lugea A, Yadav D, Pandol S. Uniting Epidemiology and Experimental Disease Models for Alcohol-Related Pancreatic Disease. Alcohol Res. 2017;38(2):173–182.
- Greer JB, Thrower E, Yadav D. EpidFemiologic and mechanistic associations between smoking and pancreatitis. Curr Treat Options Gastroenterol. 2015;13(3):332–346.
- Nawaz H, Koutroumpakis E, Easler J, et al. Elevated serum triglycerides are independently associated with persistent organ failure in acute pancreatitis. Am J Gastroenterol. 2015;110(10):1497.
- Wan J, He W, Zhu Y, et al. Stratified analysis and clinical significance of elevated serum triglyceride levels in early acute pancreatitis: a retrospective study. Lipids Health Dis. 2017; 16(1):124.
- Spanier BW, Tuynman HA, van der Hulst RW, et al. Acute pancreatitis and concomitant use of pancreatitis-associated drugs. Am J Gastroenterol. 2011;106(12):2183.
- Kahaleh M, Freeman M. Prevention and management of post-endoscopic retrograde cholangiopancreatography complications. Clin Endosc. 2012;45(3):305.
- Rosendahl J, Witt H, Szmola R, et al. Chymotrypsin C (CTRC) variants that diminish activity or secretion are associated with chronic pancreatitis. Nat Genet. 2008;40(1):78.
- Lee SP, Nicholls JF, Park HZ. Biliary sludge as a cause of acute pancreatitis. N Engl J Med. 1992; 326(9):589–593.
- Ros E, Navarro S, Bru C, et al. Occult microlithiasis in ‘idiopathic’ acute pancreatitis: prevention of relapses by cholecystectomy or ursodeoxycholic acid therapy. Gastroenterol. 1991;101(6):1701–1709.
- Repiso OA, Gomez-Rodriguez R, Romero M, et al. Prospective comparison of endoscopic ultrasonography and magnetic resonance cholangiopancreatography in the etiological diagnosis of ‘‘idiopathic’’ acute pancreatitis. Pancreas. 2011;40(2):289–294.
- Kumar S, Ooi CY, Werlin S, et al. Risk factors associated with Pediatric acute recurrent and chronic pancreatitis: Lessons from INSPPIRE. JAMA Pediatr. 2016;170(6):562.
- Jalaly NY, Moran RA, Fargahi F, et al. An evaluation of factors associated with pathogenic PRSS1, SPINK1, CTFR, and/or CTRC genetic variants in patients with idiopathic pancreatitis. Am J Gastroenterol. 2017;112(8):1320.
- Peery AF, Crockett SD, Murphy CC, et al. Burden and cost of gastrointestinal, liver, and pancreatic diseases in the United States: Update 2018. Gastroenterol. 2019;156(1):254–272.
- Yadav D, Lowenfels AB. The Epidemiology of pancreatitis and pancreatic cancer. Gastroenterol. 2013;144(6):1252–1261.
- Sellers ZM, MacIsaac D, Yu H, et al. Nationwide Trends in acute and chronic pancreatitis among privately insured children and non-elderly adults in the United States, 2007–2014. 2018;155(2):469–478.
- Xiao A, Tan ML, Plana MN, Yadav D, Zamora J, Petrov MS. The use of international classification of diseases codes to identify patients with pancreatitis: A systematic review and meta-analysis of diagnostic accuracy studies. Clin Transl Gastroenterol. 2018;9(10):191.
- Cunningham SE, Maydonovich C, Veerappan G, Betteridge J. The epidemiology of acute pancreatitis within a nationwide military population. Am J Gastroenterol. 2013;108(suppl 1):S88.
- Whitcomb DC, Frulloni L, Garg P, Greer JB, Schneider A, Yadav D, Shimosegawa T . Chronic pancreatitis: An international draft consensus proposal for a new mechanistic definition. Pancreatology. 2016;16(2):218–224.
- Sankaran SJ, Xiao AY, Wu LM, et al. Frequency of progression from acute to chronic pancreatitis and risk factors: a meta-analysis. Gastroenterol. 2015;149(6):1490–1500.
- Ahmed Ali U, Issa Y, Hagenaars JC, et al. Risk of Recurrent Pancreatitis and Progression to Chronic Pancreatitis After a First Episode of Acute Pancreatitis. Clin Gastroenterol Hepatol. 2016; 14(5):738–746.
- Machicado JD, Yadav D. Epidemiology of recurrent acute and chronic pancreatitis: Similarities and differences. Dig Dis Sci. 2017;62(7):1683–1691.
- Yadav D, Hawes RH, Brand RE, et al. for the North American Pancreatic Study Group. Alcohol consumption, cigarette smoking, and the risk of recurrent acute and chronic pancreatitis. Arch Intern Med. 2009;169(11):1035–1045.
- Yadav D, Timmons L, Benson JT, Dierkhising RA, Chari ST. Incidence, prevalence, and survival of chronic pancreatitis: A population-based study. Am J Gastroenterol. 2011;106(12):2192–2199.
- Department of Defense. Instruction 6130.03, Medical Standards for Appointment, Enlistment, or Induction into the Military Services. 6 May 2018.
- Krishna SG, Kamboj AK, Hart PA, Hinton A, Conwell DL. The Changing epidemiology of acute pancreatitis hospitalizations: A decade of trends and the impact of chronic pancreatitis. Pancreas. 2017;46(4):482–488.
- Wilcox CM, Sandhu BS, Singh V, et al. Racial differences in the clinical profile, causes, and outcome of chronic pancreatitis. Am J Gastroenterol. 2016;11(10):1488–1496.
- Yadav D, Muddana V, O’Connell M. Hospitalizations for chronic pancreatitis in Allegheny County, Pennsylvania, USA. Pancreatology. 2011;11(6):546–552.
- Yadav D, O’Connell M, Papachristou GI. Natural history following the first attack of acute pancreatitis. Am J Gastroenterol. 2012;107(7):1096–1103.
- Yadav D, Lee E, Papachristou GI, O’Connell M. A population-based evaluation of readmissions after first hospitalization for acute pancreatitis. Pancreas. 2014;43(4):630–637.
- Frey CF, Zhou H, Harvey DJ, et al. The incidence and case-fatality rates of acute biliary, alcoholic, and idiopathic pancreatitis in California, 1994-2001. Pancreas. 2006;33(4):336–344.
- Shah R, Haydek C, Mulki R, Qayed E. Incidence and predictors of 30-day readmissions in patients hospitalized with chronic pancreatitis: A nationwide analysis. Pancreatology. 2018;18(4):386–393.
- Saligram S, Lo D, Saul M, Yadav D. Analyses of hospital administrative data that use diagnosis codes overestimate the cases of acute pancreatitis. Clin Gastroenterol Hepatol. 2012;10(7):805–811.
- Reddy NG, Nangia S, DiMagno MJ. The chronic pancreatitis international classification of diseases, ninth revision, clinical modification code 577.1 is inaccurate compared with criterion-standard clinical diagnostic scoring systems. Pancreas. 2016;45(9):1276–1281.
- Pendharkar SA, Mathew J, Petrov MS. Age-and sex-specific prevalence of diabetes associated with diseases of the exocrine pancreas: a population based study. Dig Liver Dis. 2017; 49(5):540–544.
- Razavi D, Ljung R, Lu Y, Andren-Sandberg A, Lindblad M. Reliability of acute pancreatitis diagnosis coding in a national patient register: a validation study in Sweden. Pancreatology. 2011;11(5):525–532.