Military Health System

Hospitalizations, Active Component, U.S. Armed Forces, 2020

Image of 02_Surgery_hospitalizations. 02_Surgery_hospitalizations

Recommended Content:

Medical Surveillance Monthly Report

What Are the New Findings?

The hospitalization rate in 2020 was 47.1 per 1,000 person-years, the lowest rate of the most recent 10 years, during which period annual rates steadily declined. As in prior years, the majority (70.9%) of hospitalizations were associated with diagnoses in the categories of mental health disorders, pregnancy-related conditions, injury/poisoning, and digestive system disorders.

What Is the Impact on Readiness and Force Health Protection?

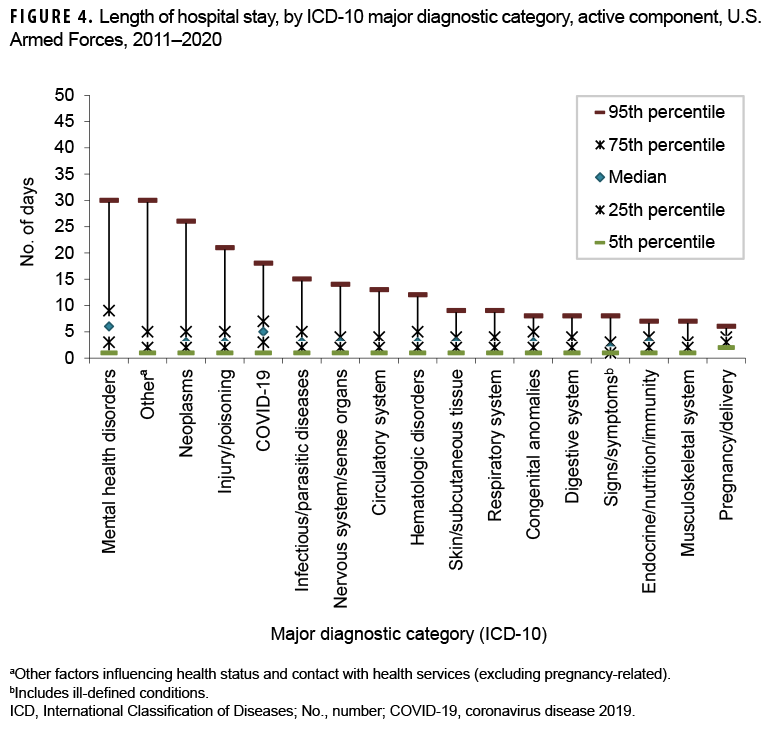
Not only are mental health disorders the most common diagnoses associated with hospitalizations, they are associated with the longest median hospital stay (6 days). Moreover, 5% of hospitalizations for mental health disorders had durations of stay greater than 30 days. Prolonged hospitalizations, subsequent aftercare, and early attrition because of such common disorders can have a negative impact on individual and unit operational readiness.

Background

This report documents the frequencies, rates, trends, and distributions of hospitalizations of active component members of the U.S. Army, Navy, Air Force, and Marine Corps during calendar year 2020. Summaries are based on standardized records of hospitalizations at U.S. military and non-military (reimbursed care) medical facilities worldwide. For this report, primary (first-listed) discharge diagnoses are considered indicative of the primary reasons for hospitalizations; summaries are based on the first 3 digits of the International Classification of Diseases, 10th Revision, used to report primary discharge diagnoses. Hospitalizations not routinely documented with standardized, automated records (e.g., during field training exercises or while shipboard) are not centrally available for health surveillance purposes and thus are not included in this report.

Frequencies, rates, and trends

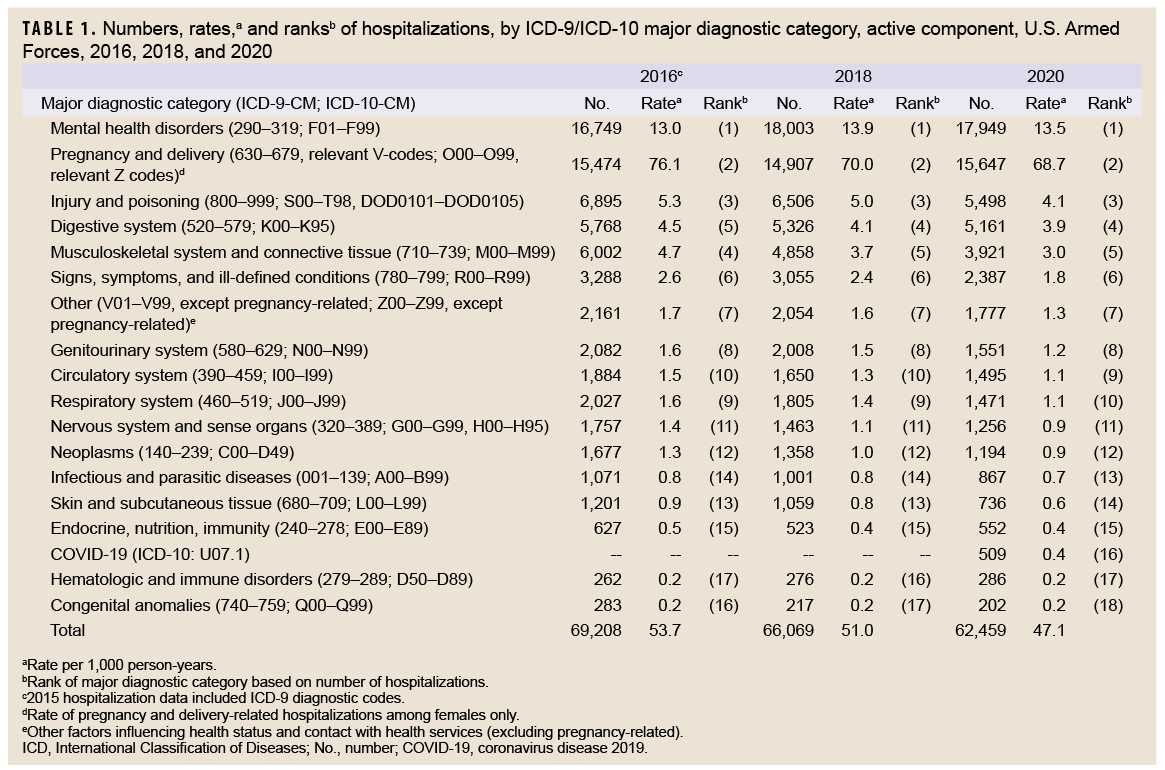
In 2020, there were 62,459 records of hospitalizations of active component members of the U.S. Army, Navy, Air Force, and Marine Corps (Table 1); 33.7% of the hospitalizations were in non-military facilities (data not shown). The annual hospitalization rate (all causes) for 2020 was 47.1 per 1,000 service member person-years (p-yrs). This rate was the lowest of the years covered in this report (2011–2020), during which rates fell steadily each year until 2019 when the rate (52.2 per 1,000 p-yrs) exceeded that of 2018 (51.0 per 1,000 p-yrs) (Figure 1).

Hospitalizations, by illness and injury categories

In 2020, 4 diagnostic categories accounted for 70.9% of all hospitalizations of active component members: mental health disorders (28.7%), pregnancy- and delivery-related conditions (25.1%), injury/poisoning (8.8%), and digestive system disorders (8.3%) (Table 1). Similar to 2016 and 2018, in 2020 there were more hospitalizations for mental health disorders than for any other major diagnostic category (per ICD-10); 2009 was the last year in which the number of hospitalizations for pregnancy- and delivery-related conditions exceeded the number for mental health disorders (data not shown).

Comparing 2020 to 2016, numbers of hospitalizations decreased in all major categories of illnesses and injuries except for mental health disorders, pregnancy and delivery, and hematologic and immune disorders, which increased 7.2%, 1.1%, and 9.2%, respectively (Table 1). The largest drop in the number of hospitalizations during 2016–2020 was seen in the category of "musculoskeletal system and connective system disorders" hospitalization difference, 2016–2020: -2,081; 34.7% decrease).

Hospitalizations, by sex

In 2020, the hospitalization rate (all causes) among females was more than 3 times that of males (114.8 per 1,000 p-yrs vs. 32.6 per 1,000 p-yrs, respectively). Excluding pregnancy and delivery, the rate of hospitalizations among females (46.1 per 1,000 p-yrs) was 41.6% higher than among males (data not shown).

Overall hospitalization rates were higher (i.e., the rate difference [RD] was greater than 1.0 per 1,000 p-yrs) among females than males for mental health disorders (female:male, RD: 7.4 per 1,000 p-yrs); genitourinary disorders (RD: 2.9 per 1,000 p-yrs); and neoplasms (RD: 1.4 per 1,000 p-yrs) (data not shown). With the exception of pregnancy- and delivery-related conditions, hospitalization rates were similar among males and females for the remaining 13 major disease-specific categories (data not shown).

Relationships between age and hospitalization rates varied considerably across illness- and injury-specific categories. For example, among both males and females, hospitalization rates generally increased with age for musculoskeletal system/connective tissue disorders, neoplasms, and circulatory, genitourinary, digestive, nervous, and endocrine/nutrition/immunity disorders (Figure 2). Among service members aged 30 years or older, there was a pronounced difference by sex in the slopes of the rates of neoplasms, with the rates among females notably higher than among males in the same age groups. Rates decreased with age for mental health disorders but were relatively stable across age groups for injury/poisoning, signs/symptoms/ill-defined conditions, and infectious/parasitic diseases.

Most frequent diagnoses

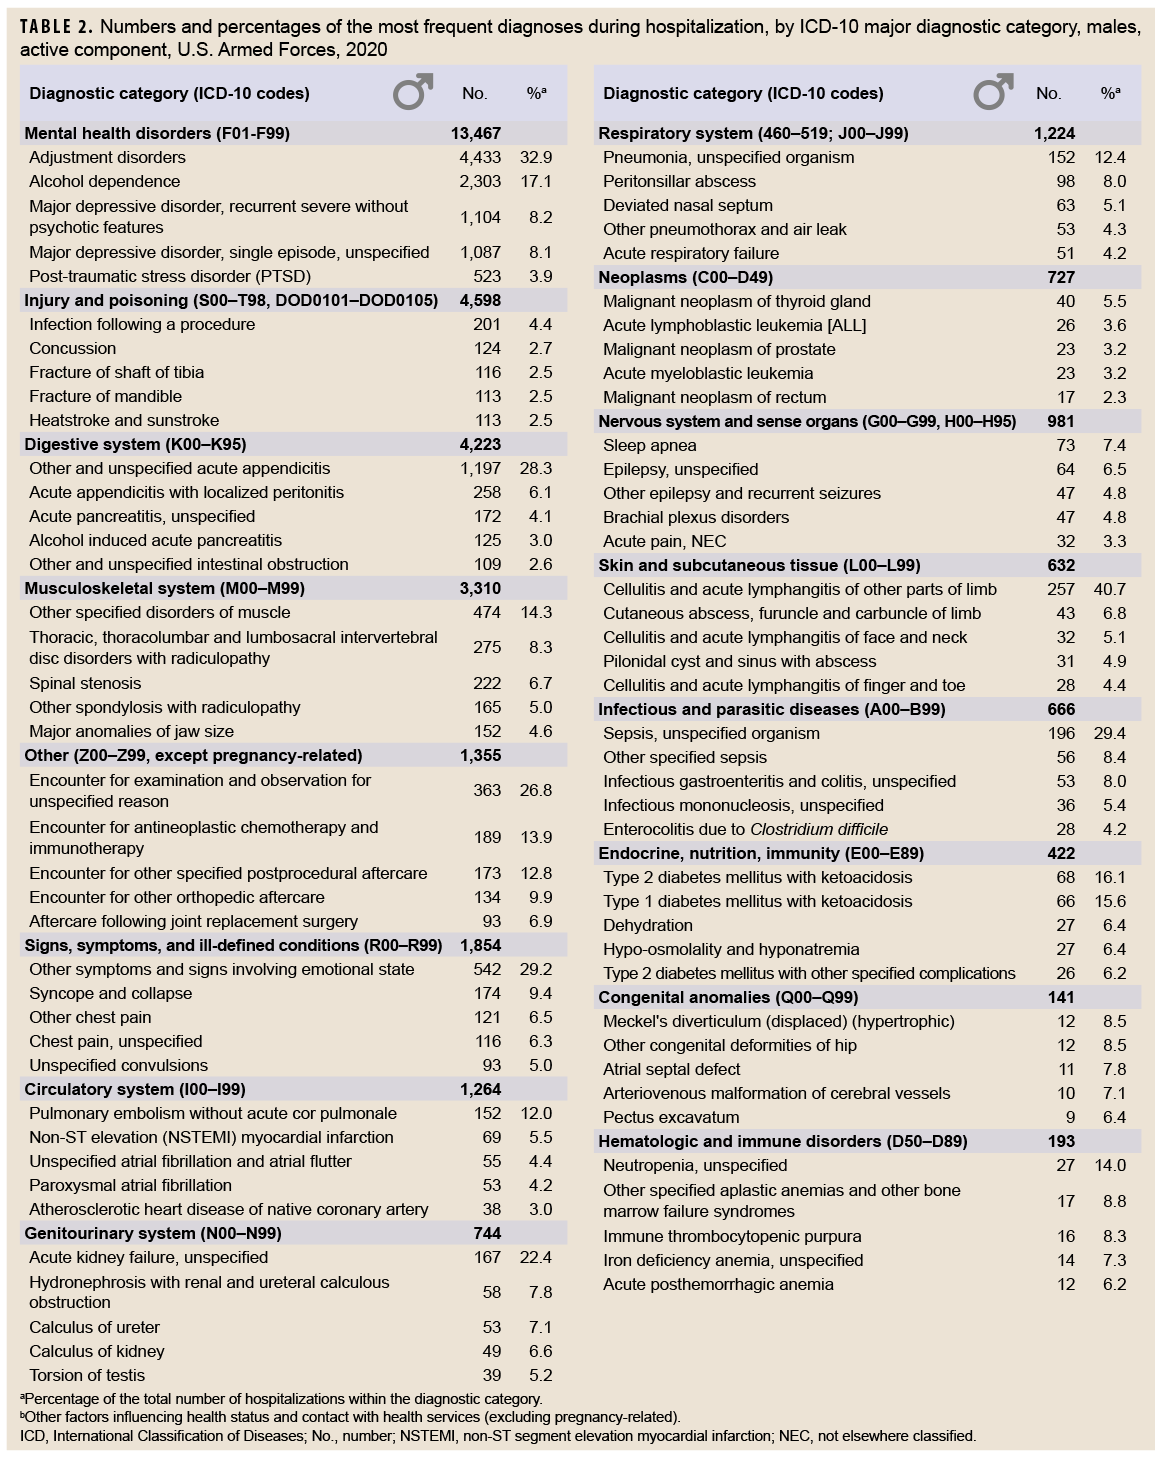
In 2020, adjustment disorder was the most frequent discharge diagnosis among males (n=4,433) (Table 2). Alcohol dependence (n=2,303), acute appendicitis (n=1,197), major depressive disorder [recurrent, severe without psychotic features] (n=1,104), major depressive disorder [single episode, unspecified] (n=1,087), other symptoms and signs involving emotional state (n=542), and post-traumatic stress disorder (PTSD) (n=523) were the next 6 most frequent diagnoses in males (Table 2).

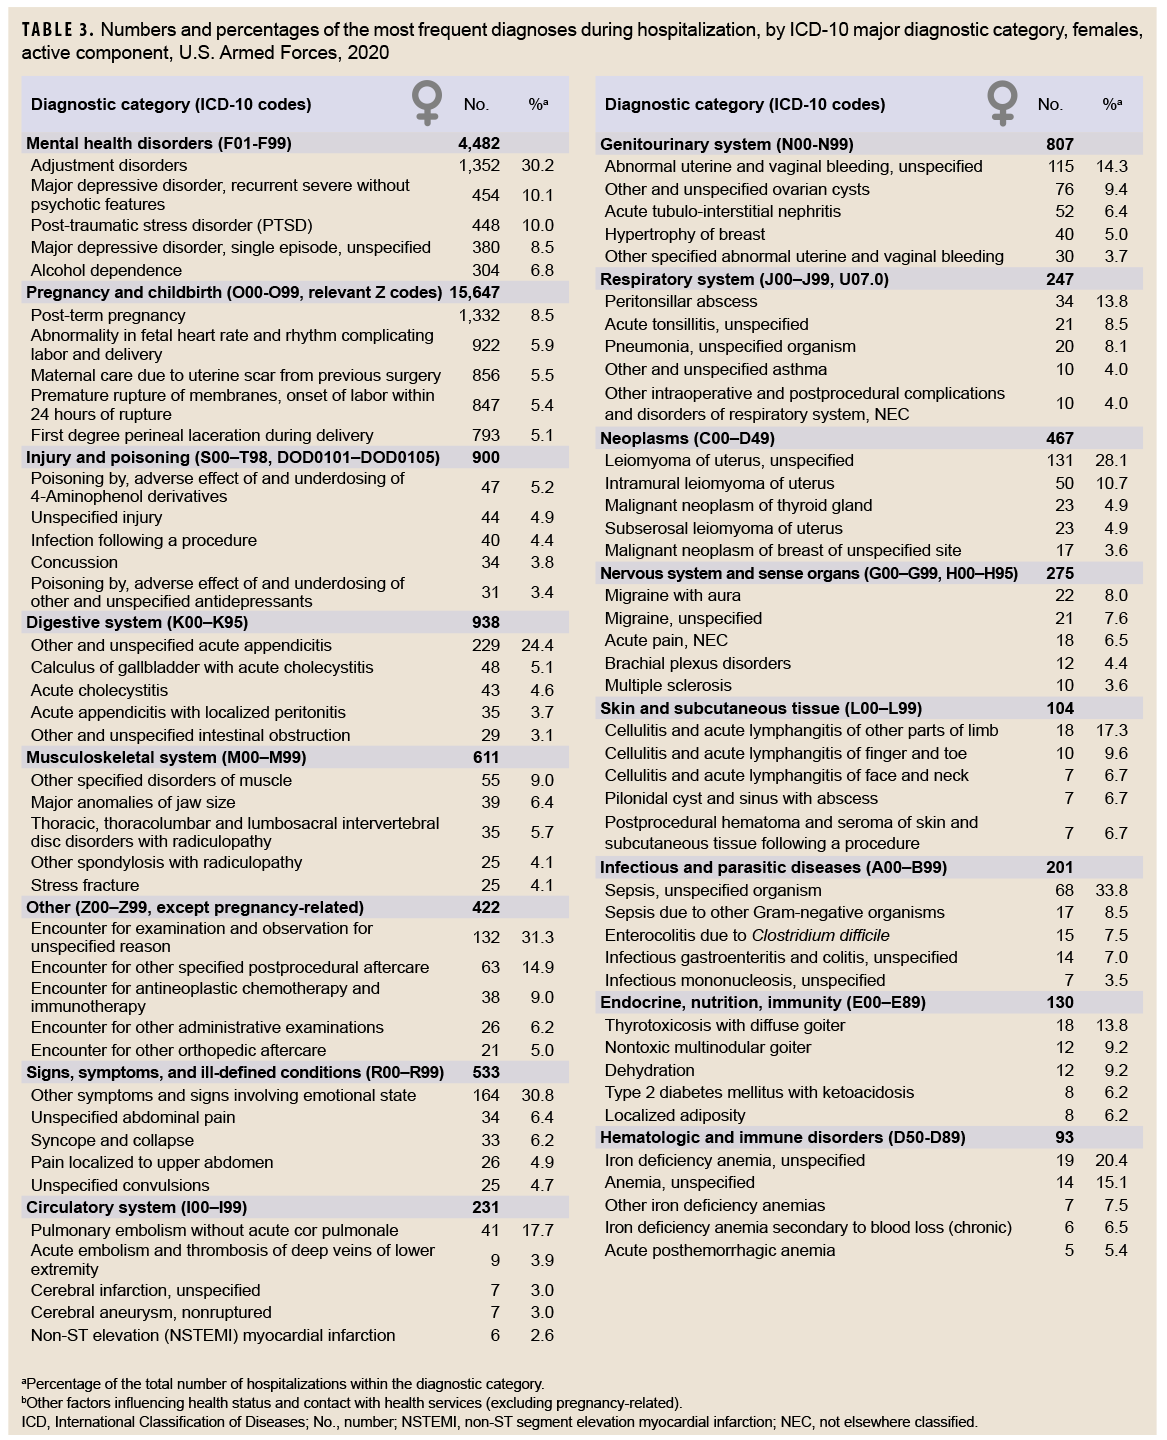
In 2020, the most frequent discharge diagnosis among females was adjustment disorder (n=1,352). Pregnancy- and delivery-related conditions represented the next 5 leading causes of hospitalizations among females, and this category alone accounted for 59.7% of all hospitalizations of females (Table 3). The top 5 discharge diagnoses in this condition category included post-term (late) pregnancy (n=1,332), abnormality in fetal heart rate and rhythm (n=922), maternal care due to uterine scar from previous surgery (n=856), premature rupture of membranes [onset of labor within 24 hours of rupture] (n=847), and first degree perineal laceration during delivery (n=793). After the top 6 discharge diagnoses described above for females, the other leading causes of hospitalizations among females were recurrent major depressive disorder without psychotic features (n=454), PTSD (n=448), major depressive disorder [single episode, unspecified] (n=380), and alcohol dependence (n=304). Combined, mental health disorder diagnoses accounted for one-sixth (17.1%) of all hospitalizations of females.

Injury/poisoning

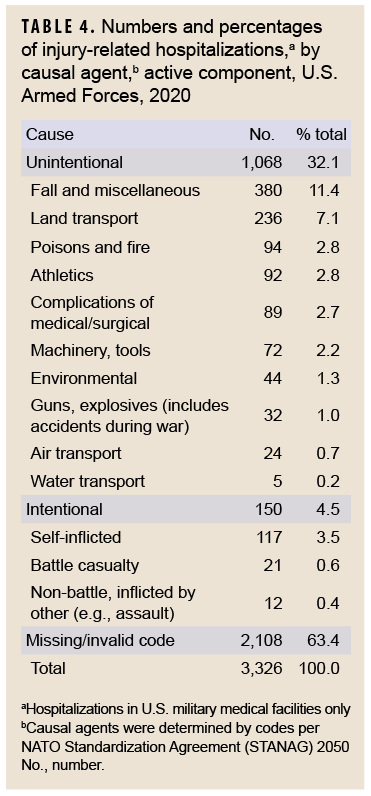
As in the past, in 2020, injury/poisoning was the third leading cause of hospitalizations of U.S. military members (Table 1). Of all injury/poisoning-related hospitalizations in U.S. military medical facilities (n=3,326), more than half (63.4%) had a missing or invalid NATO Standardization Agreement (STANAG) code (Table 4). More than one-third (35.6%) of all "unintentional" injury/poisoning-related hospitalizations in U.S. military facilities (n=1,068) were considered caused by falls and miscellaneous (n=380), while land transport (n=236) accounted for 22.1% of "unintentional" injury/poisoning-related hospitalizations (Table 4)

Among males, injury/poisoning-related hospitalizations were most often related to infection following a procedure, concussion, fracture of the tibial shaft, or fracture of the mandible (Table 2). Among females, injury/poisoning-related hospitalizations were most often related to poisoning by/adverse effect of acetaminophen derivatives, unspecified injury, infection following a procedure, concussion, or poisoning by/adverse effect of/under dosing of other and unspecified antidepressants (Table 3).

Durations of hospitalizations

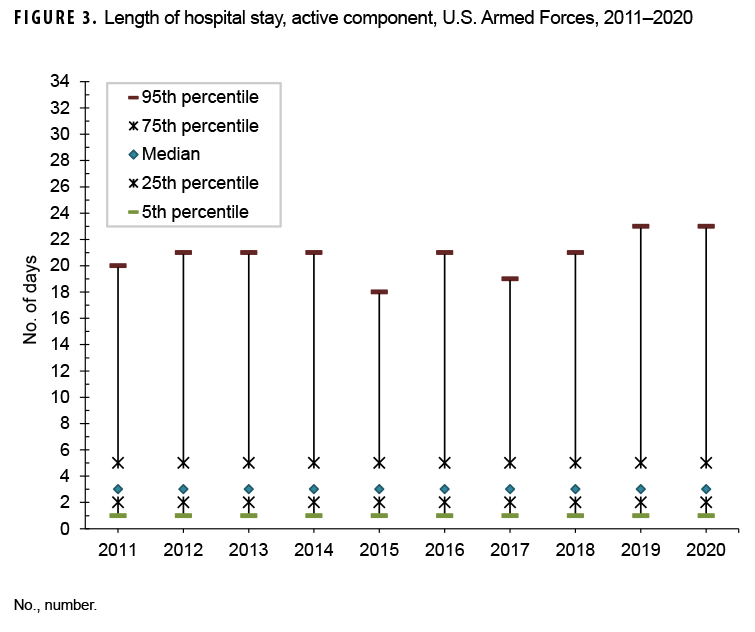
During 2011–2020, the median duration of hospital stays (all causes) remained stable at 3 days (Figure 3). As in previous years, medians and ranges of durations of hospitalizations varied considerably across major diagnostic categories. For example, median lengths of hospitalizations varied from 2 days (e.g., musculoskeletal system disorders; genitourinary system disorders; signs, symptoms, and ill-defined conditions) to 6 days (mental health disorders). For most diagnostic categories, less than 5% of hospitalizations exceeded 12 days, but for 7 categories, 5% of hospitalizations had longer durations: circulatory system disorders (13 days), nervous system/sense organ disorders (14 days), infectious/parasitic diseases (15 days), injury/poisoning (21 days), neoplasms (26 days), other non-pregnancy-related factors influencing health status and contact with health services (primarily orthopedic aftercare and rehabilitation following a previous illness or injury) (30 days), and mental health disorders (30 days) (Figure 4). It is noteworthy that, for one specific infectious disease, COVID-19, although the median length of hospital stay was 5 days, 5% of patients had hospital stays of 18 days or longer.

Hospitalizations, by service

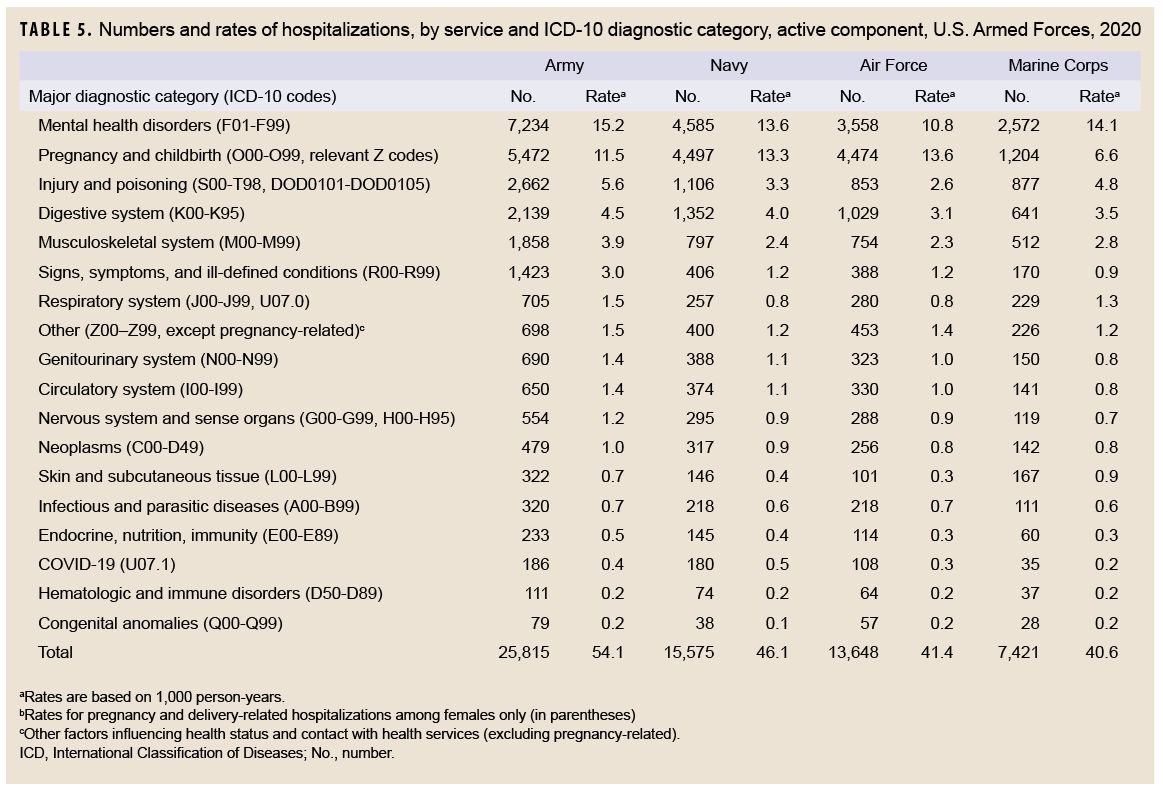
Among active component members of the Air Force, pregnancy- and delivery-related conditions accounted for more hospitalizations than any other category of illnesses or injuries; however, among active component members of the Army, Navy, and Marine Corps, mental health disorders were the leading cause of hospitalizations (Table 5). For the Navy, this was a change from the results for 2019, when pregnancy and delivery-related conditions were most numerous. The crude hospitalization rate for mental health disorders among active component Army members (15.2 per 1,000 p-yrs) was higher than among members of all other services.

Injury/poisoning was the third leading cause of hospitalizations in the Army and the Marine Corps, and fourth in the Navy and Air Force (Table 5). The hospitalization rate for injury/poisoning was highest among Army (5.6 per 1,000 p-yrs) and Marines Corps members (4.8 per 1,000 p-yrs) and lowest among Air Force members (2.6 per 1,000 p-yrs).

Editorial Comment

The hospitalization rate for all causes among active component members in 2020 was the lowest rate of the past 10 years. As in past years, in 2020, mental health disorders, pregnancy- and delivery-related conditions, and injury/poisoning accounted for more than half of all hospitalizations of active component members. Adjustment and mood disorders were among the leading causes of hospitalizations among both male and female service members. In recent years, attention at the highest levels of the U.S. military and significant resources have focused on detecting, diagnosing, and treating mental health disorders—especially those related to long and repeated deployments and combat stress. Annual crude rates of hospitalizations for mental health disorders increased between 2015 and 2017 and have remained relatively stable between 2017 and 2020. The annual number of mental health disorder-related hospitalizations has been approximately 18,000 since 2017. 

The reasons for the recent downturn in the trends for annual numbers of hospitalizations overall and for the slight increase in mental health disorder–related hospitalizations in particular are not clear. It is conceivable that there has been a decline in the impact of combat and peacekeeping operations on overall morbidity among service members since the withdrawal of U.S. forces from Iraq and the official end to combat operations in Afghanistan. The decrease in hospitalizations in 2020 may also have been a consequence of the COVID-19 pandemic, during which elective admissions to hospitals were discouraged and the public health measures of social distancing and use of personal protective equipment may have reduced the incidence of not only infectious diseases but also of injuries. Continued monitoring of hospitalizations and all other health care encounters over time may permit elucidation of the possible reasons for the recent trends in hospitalization. 

This summary has certain limitations that should be considered when interpreting the results. For example, the scope of this report is limited to members of the active components of the U.S. Armed Forces. Many reserve component members were hospitalized for illnesses and injuries while serving on active duty in 2020; however, these hospitalizations are not accounted for in this report. Please refer to the snapshot pertaining to the reserve component elsewhere in this issue of the MSMR. In addition, many injury/poisoning-related hospitalizations occur in non-military hospitals. If there are significant differences between the causes of injuries and poisonings that resulted in hospitalizations in U.S. military and non-military hospitals, the summary of external causes of injuries requiring hospital treatment reported here (Table 4) could be misleading. Also, this summary is based on primary (first-listed) discharge diagnoses only; however, in many hospitalized cases, there are multiple underlying conditions.

For example, military members who are wounded in combat or injured in motor vehicle accidents may have multiple injuries and complex medical and psychological complications. In such cases, only the first-listed discharge diagnosis would be accounted for in this report. Finally, it should be noted that medical data from sites that were using the new electronic health record for the Military Health System, MHS GENESIS, between July 2017 and Oct. 2019 are not available in the DMSS. These sites include Naval Hospital Oak Harbor, Naval Hospital Bremerton, Air Force Medical Services Fairchild, and Madigan Army Medical Center. Therefore, medical encounter data for individuals seeking care at any of these facilities from July 2017 through Oct. 2019 were not included in the current analysis. Even with these limitations, this report provides useful and informative insights regarding the natures, rates, and distributions of the most serious illnesses and injuries that affect active component military members.
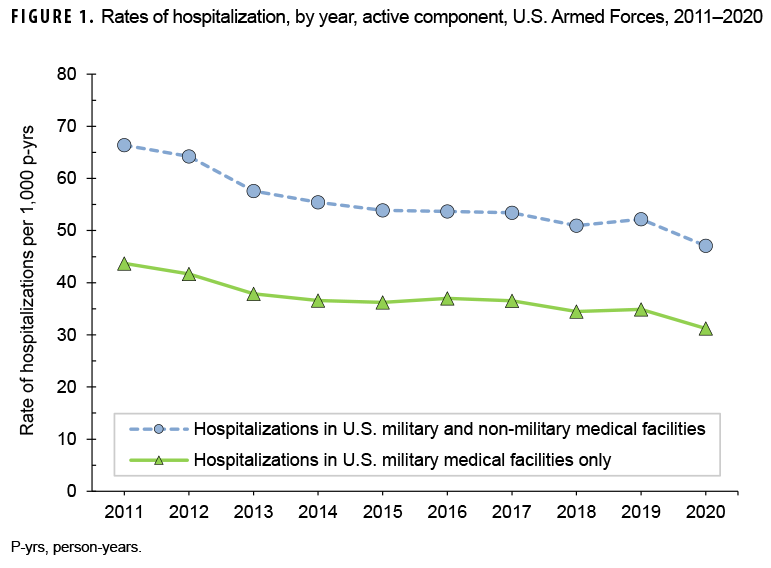
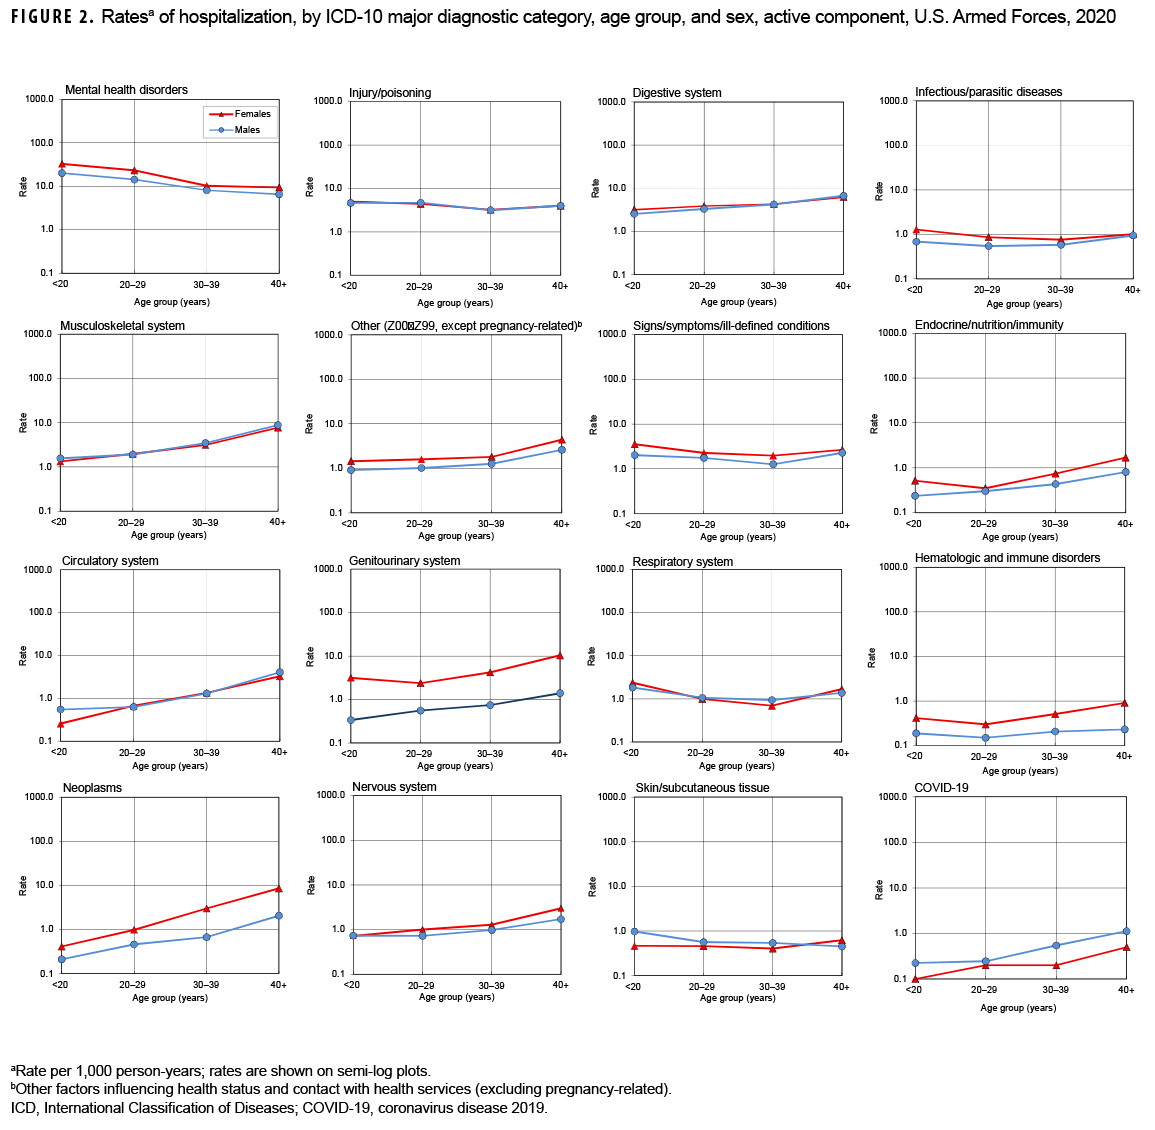
FIGURE 1. Rates of hospitalization, by year, active component, U.S. Armed Forces, 2011–2020

FIGURE 2. Ratesa of hospitalization, by ICD-10 major diagnostic category, age group, and sex, active component, U.S. Armed Forces, 2020

FIGURE 3. Length of hospital stay, active component, U.S. Armed Forces, 2011–2020

FIGURE 4. Length of hospital stay, by ICD-10 major diagnostic category, active component, U.S. Armed Forces, 2011–2020


Table 1
TABLE 2. Numbers and percentages of the most frequent diagnoses during hospitalization, by ICD-10 major diagnostic category, males, active component, U.S. Armed Forces, 2020

TABLE 3. Numbers and percentages of the most frequent diagnoses during hospitalization, by ICD-10 major diagnostic category, females, active component, U.S. Armed Forces, 2020

TABLE 4. Numbers and percentages of injury-related hospitalizations,a by causal agent,b active component, U.S. Armed Forces, 2020

TABLE 5. Numbers and rates of hospitalizations, by service and ICD-10 diagnostic category, active component, U.S. Armed Forces, 2020

You also may be interested in...

Vasectomy and Vasectomy Reversals, Active Component, U.S. Armed Forces, 2000–2017

Article
3/1/2019
Sperm is the male reproductive cell  Photo: iStock

During 2000–2017, a total of 170,878 active component service members underwent a first-occurring vasectomy, for a crude overall incidence rate of 8.6 cases per 1,000 person-years (p-yrs). Among the men who underwent incident vasectomy, 2.2% had another vasectomy performed during the surveillance period. Compared to their respective counterparts, the overall rates of vasectomy were highest among service men aged 30–39 years, non-Hispanic whites, married men, and those in pilot/air crew occupations. Male Air Force members had the highest overall incidence of vasectomy and men in the Marine Corps, the lowest. Crude annual vasectomy rates among service men increased slightly between 2000 and 2017. The largest increases in rates over the 18-year period occurred among service men aged 35–49 years and among men working as pilots/air crew. Among those who underwent vasectomy, 1.8% also had at least 1 vasectomy reversal during the surveillance period. The likelihood of vasectomy reversal decreased with advancing age. Non-Hispanic black and Hispanic service men were more likely than those of other race/ethnicity groups to undergo vasectomy reversals.

Recommended Content:

Medical Surveillance Monthly Report

Sexually Transmitted Infections, Active Component, U.S. Armed Forces, 2010–2018

Article
3/1/2019
Neisseria gonorrhoeae Photo Courtesy of CDC: M Rein

This report summarizes incidence rates of the 5 most common sexually transmitted infections (STIs) among active component service members of the U.S. Armed Forces during 2010–2018. Infections with chlamydia were the most common, followed in decreasing order of frequency by infections with genital human papillomavirus (HPV), gonorrhea, genital herpes simplex virus (HSV), and syphilis. Compared to men, women had higher rates of all STIs except for syphilis. In general, compared to their respective counterparts, younger service members, non-Hispanic blacks, soldiers, and enlisted members had higher incidence rates of STIs. During the latter half of the surveillance period, the incidence of chlamydia and gonorrhea increased among both male and female service members. Rates of syphilis increased for male service members but remained relatively stable among female service members. In contrast, the incidence of genital HPV and HSV decreased among both male and female service members. Similarities to and differences from the findings of the last MSMR update on STIs are discussed.

Recommended Content:

Medical Surveillance Monthly Report

Outbreak of Acute Respiratory Illness Associated with Adenovirus Type 4 at the U.S. Naval Academy, 2016

Article
2/1/2019
Malaria case definition

Human adenoviruses (HAdVs) are known to cause respiratory illness outbreaks at basic military training (BMT) sites. HAdV type-4 and -7 vaccines are routinely administered at enlisted BMT sites, but not at military academies. During Aug.–Sept. 2016, U.S. Naval Academy clinical staff noted an increase in students presenting with acute respiratory illness (ARI). An investigation was conducted to determine the extent and cause of the outbreak. During 22 Aug.–11 Sept. 2016, 652 clinic visits for ARI were identified using electronic health records. HAdV-4 was confirmed by real-time polymerase chain reaction assay in 18 out of 33 patient specimens collected and 1 additional HAdV case was detected from hospital records. Two HAdV-4 positive patients were treated for pneumonia including 1 hospitalized patient. Molecular analysis of 4 HAdV-4 isolates identified genome type 4a1, which is considered vaccine-preventable. Understanding the impact of HAdV in congregate settings other than enlisted BMT sites is necessary to inform discussions regarding future HAdV vaccine strategy.

Recommended Content:

Medical Surveillance Monthly Report

Re-evaluation of the MSMR Case Definition for Incident Cases of Malaria

Article
2/1/2019
Anopheles merus

The MSMR has been publishing the results of surveillance studies of malaria since 1995. The standard MSMR case definition uses Medical Event Reports and records of hospitalizations in counting cases of malaria. This report summarizes the performance of the standard MSMR case definition in estimating incident cases of malaria from 2015 through 2017. Also explored was the potential surveillance value of including outpatient encounters with diagnoses of malaria or positive laboratory tests for malaria in the case definition. The study corroborated the relative accuracy of the MSMR case definition in estimating malaria incidence and provided the basis for updating the case definition in 2019 to include positive laboratory tests for malaria antigen within 30 days of an outpatient diagnosis.

Recommended Content:

Medical Surveillance Monthly Report

Update: Malaria, U.S. Armed Forces, 2018

Article
2/1/2019
Anopheles merus

Malaria infection remains an important health threat to U.S. service mem­bers who are located in endemic areas because of long-term duty assign­ments, participation in shorter-term contingency operations, or personal travel. In 2018, a total of 58 service members were diagnosed with or reported to have malaria. This represents a 65.7% increase from the 35 cases identi­fied in 2017. The relatively low numbers of cases during 2012–2018 mainly reflect decreases in cases acquired in Afghanistan, a reduction due largely to the progressive withdrawal of U.S. forces from that country. The percentage of cases of malaria caused by unspecified agents (63.8%; n=37) in 2018 was the highest during any given year of the surveillance period. The percent­age of cases identified as having been caused by Plasmodium vivax (10.3%; n=6) in 2018 was the lowest observed during the 10-year surveillance period. The percentage of malaria cases attributed to P. falciparum (25.9 %) in 2018 was similar to that observed in 2017 (25.7%), although the number of cases increased. Malaria was diagnosed at or reported from 31 different medical facilities in the U.S., Afghanistan, Italy, Germany, Djibouti, and Korea. Pro­viders of medical care to military members should be knowledgeable of and vigilant for clinical manifestations of malaria outside of endemic areas.

Recommended Content:

Medical Surveillance Monthly Report

Update: Incidence of Glaucoma Diagnoses, Active Component, U.S. Armed Forces, 2013–2017

Article
2/1/2019
Glaucoma

Glaucoma is an eye disease that involves progressive optic nerve damage and vision loss, leading to blindness if undetected or untreated. This report describes an analysis using the Defense Medical Surveillance System to identify all active component service members with an incident diagnosis of glaucoma during the period between 2013 and 2017. The analysis identified 37,718 incident cases of glaucoma and an overall incidence rate of 5.9 cases per 1,000 person-years (p-yrs). The majority of cases (97.6%) were diagnosed at an early stage as borderline glaucoma; of these borderline cases, 2.2% progressed to open-angle glaucoma during the study period. No incident cases of absolute glaucoma, or total blindness, were identified. Rates of glaucoma were higher among non-Hispanic black (11.0 per 1,000 p-yrs), Asian/Pacific Islander (9.5), and Hispanic (6.9) service members, compared with non-Hispanic white (4.0) service members. Rates among female service members (6.6 per 1,000 p-yrs) were higher than those among male service members (5.8). Between 2013 and 2017, incidence rates of glaucoma diagnoses increased by 75.4% among all service members.

Recommended Content:

Medical Surveillance Monthly Report

Thyroid Disorders, Active Component, U.S. Armed Forces, 2008–2017

Article
12/1/2018
Cover 1

This analysis describes the incidence and prevalence of five thyroid disorders (goiter, thyrotoxicosis, primary/not otherwise specified [NOS] hypothyroidism, thyroiditis, and other disorders of the thyroid) among active component service members between 2008 and 2017. During the 10-year surveillance period, the most common incident thyroid disorder among male and female service members was primary/NOS hypothyroidism and the least common were thyroiditis and other disorders of thyroid. Primary/NOS hypothyroidism was diagnosed among 8,641 females (incidence rate: 43.7 per 10,000 person-years [p-yrs]) and 11,656 males (incidence rate: 10.2 per 10,000 p-yrs). Overall incidence rates of all thyroid disorders were 3 to 5 times higher among females compared to males. Among both males and females, incidence of primary/NOS hypothyroidism was higher among non-Hispanic white service members compared with service members in other race/ethnicity groups. The incidence of most thyroid disorders remained stable or decreased during the surveillance period. Overall, the prevalence of most thyroid disorders increased during the first part of the surveillance period and then either decreased or leveled off.31.6 per 100,000 active component service members in 2017. Validation of ICD-9/ICD-10 diagnostic codes for MetS using the National Cholesterol Education Program Adult Treatment Panel III criteria is needed to establish the level of agreement between the two methods for identifying this condition.

Recommended Content:

Medical Surveillance Monthly Report

Adrenal Gland Disorders, Active Component, U.S. Armed Forces, 2002–2017

Article
12/1/2018
Adrenal Gland Disorders, Active Component, U.S. Armed Forces, 2002–2017

During 2002–2017, the most common incident adrenal gland disorder among male and female service members was adrenal insufficiency and the least common was adrenomedullary hyperfunction. Adrenal insufficiency was diagnosed among 267 females (crude overall incidence rate: 8.2 cases per 100,000 person-years [p-yrs]) and 729 males (3.9 per 100,000 p-yrs). In both sexes, overall rates of other disorders of adrenal gland and Cushing’s syndrome were lower than for adrenal insufficiency but higher than for hyperaldosteronism, adrenogenital disorders, and adrenomedullary hyperfunction. Crude overall rates of adrenal gland disorders among females tended to be higher than those of males, with female:male rate ratios ranging from 2.1 for adrenal insufficiency to 5.5 for androgenital disorders and Cushing’s syndrome. The highest overall rates of adrenal insufficiency for males and females were among non-Hispanic white service members. Among females, rates of Cushing's syndrome and other disorders of adrenal gland were 31.6 per 100,000 active component service members in 2017. Validation of ICD-9/ICD-10 diagnostic codes for MetS using the National Cholesterol Education Program Adult Treatment Panel III criteria is needed to establish the level of agreement between the two methods for identifying this condition.

Recommended Content:

Medical Surveillance Monthly Report

Incidence and Prevalence of the Metabolic Syndrome Using ICD-9 and ICD-10 Diagnostic Codes, Active Component, U.S. Armed Forces, 2002–2017

Article
12/1/2018
Incidence and Prevalence of the Metabolic Syndrome Using ICD-9 and ICD-10 Diagnostic Codes, Active Component, U.S. Armed Forces, 2002–2017

This report uses ICD-9 and ICD-10 codes (277.7 and E88.81, respectively) for the metabolic syndrome (MetS) to summarize trends in the incidence and prevalence of this condition among active component members of the U.S. Armed Forces between 2002 and 2017. During this period, the crude overall incidence rate of MetS was 7.5 cases per 100,000 person-years (p-yrs). Compared to their respective counterparts, overall incidence rates were highest among Asian/Pacific Islanders, Air Force members, and warrant officers and were lowest among those of other/unknown race/ethnicity, Marine Corps members, and junior enlisted personnel and officers. During 2002–2017, the annual incidence rates of MetS peaked in 2009 at 11.6 cases per 100,000 p-yrs and decreased to 5.9 cases per 100,000 p-yrs in 2017. Annual prevalence rates of MetS increased steadily during the first 11 years of the surveillance period reaching a high of 38.9 per 100,000 active component service members in 2012, after which rates declined slightly to 31.6 per 100,000 active component service members in 2017. Validation of ICD-9/ICD-10 diagnostic codes for MetS using the National Cholesterol Education Program Adult Treatment Panel III criteria is needed to establish the level of agreement between the two methods for identifying this condition.

Recommended Content:

Medical Surveillance Monthly Report

2018 #ColdReadiness Twitter chat recap: Preventing cold weather injuries for service members and their families

Fact Sheet
2/5/2018

To help protect U.S. armed forces, the Armed Forces Health Surveillance Branch (AFHSB) hosted a live #ColdReadiness Twitter chat on Wednesday, January 24th, 12-1:30 pm EST to discuss what service members and their families need to know about winter safety and preventing cold weather injuries as the temperatures drop. This fact sheet documents highlights from the Twitter chat.

Recommended Content:

Medical Surveillance Monthly Report | Winter Safety | Medical and Dental Preventive Care Fitness | Health Readiness & Combat Support

Heat Illnesses by Location, Active Component, U.S. Armed Forces, 2012-2016 Fact Sheet

Fact Sheet
3/30/2017

This fact sheet provides details on heat illnesses by location during a five-year surveillance period from 2012 through 2016. 11,967 heat-related illnesses were diagnosed at more than 250 military installations and geographic locations worldwide. Three Army Installations accounted for close to one-third of all heat illnesses during the period.

Recommended Content:

Armed Forces Health Surveillance Division | Medical Surveillance Monthly Report

Rhabdomyolysis by Location, Active Component, U.S. Armed Forces, 2012-2016 Fact Sheet

Fact Sheet
3/30/2017

This fact sheet provides details on Rhabdomyolysis by location for active component, U.S. Armed Forces during a five-year surveillance period from 2012 through 2016. The medical treatment facilities at nine installations diagnosed at least 50 cases each and, together approximately half (49.9%) of all diagnosed cases.

Recommended Content:

Armed Forces Health Surveillance Division | Medical Surveillance Monthly Report

Demographic and Military Traits of Service Members Diagnosed as Traumatic Brain Injury Cases

Fact Sheet
3/30/2017

This fact sheet provides details on the demographic and military traits of service members diagnosed as traumatic brain injury (TBI) cases during a 16-year surveillance period from 2001 through 2016, a total of 276,858 active component service members received first-time diagnoses of TBI - a structural alteration of the brain or physiological disruption of brain function caused by an external force.

Recommended Content:

Armed Forces Health Surveillance Division | Medical Surveillance Monthly Report
<< < ... 11 12 13 14 > >> 
Showing results 196 - 208 Page 14 of 14
Refine your search
Last Updated: October 14, 2022
Follow us on Instagram Follow us on LinkedIn Follow us on Facebook Follow us on Twitter Follow us on YouTube Sign up on GovDelivery