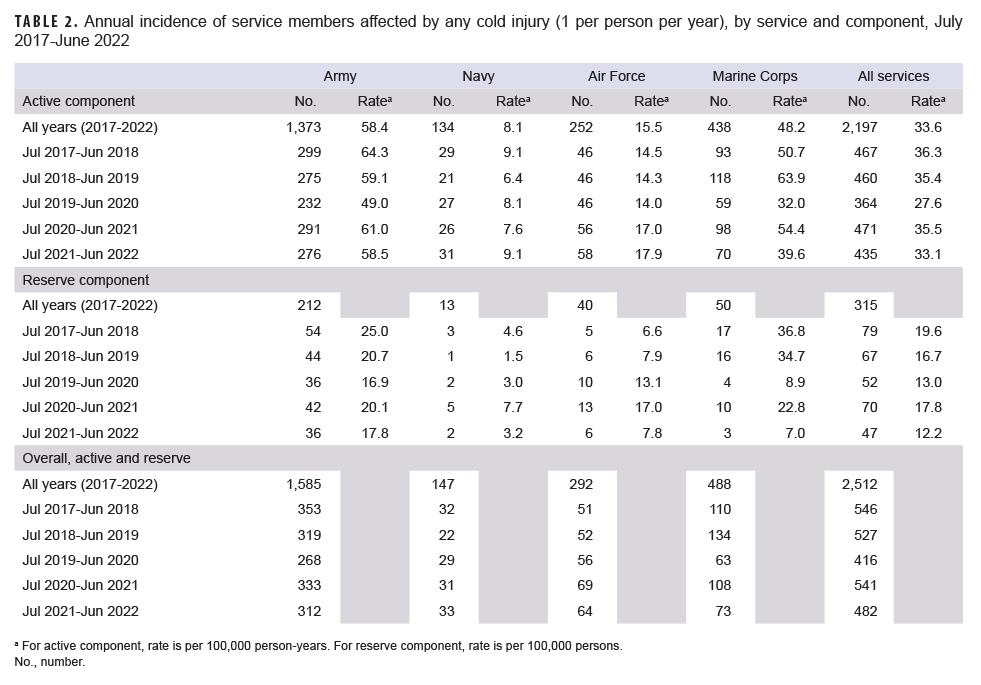
From July 2021 through June 2022, a total of 482 members of the active (n=435) and reserve (n=47) components had at least 1 cold injury. The crude overall incidence rate of cold injury for all active component service members in 2021–2022 (33.1 per 100,000 person-years [p-yrs]) was slightly lower than the rate for the 2020–2021 cold season (35.5 per 100,000 p-yrs). In 2021–2022, frostbite was the most common type of cold injury among active component service members in all 4 services. Among active component members during the 2017–2022 cold seasons, overall rates of cold injuries were generally highest among male service members, non-Hispanic Black service members, the youngest (less than 20 years old), and those who were enlisted. The number of cold injuries associated with overseas deployments during the 2021–2022 cold season (n=13) was similar to the two previous cold seasons (10 in 2019-2020 and 11 in 2020-2021). Frostbite accounted for more than half (n=9) of the cold injuries identified in service members deployed outside of the U.S. during the 2021–2022 cold season.
What are the new findings?
For all active component service members, the rate of cold injuries in 2021–2022 decreased slightly compared to the previous cold year. Cold injury rates were much higher among members of the Army and Marine Corps. The number of cold injuries associated with deployment during 2021–2022 was similar to the two preceding cold years.
What is the impact on readiness and force health protection?
Military training and combat operations will require continued emphasis on effective cold injury prevention strategies and adherence to the policies and procedures in place to protect service members against such injuries. Cold injuries are of significant military concern because of their adverse impact on operations and the high financial costs of treatment and disability.1,2 In response, the U.S. Armed Forces have developed and improved training, doctrine, procedures, and protective equipment and clothing to counter the threat from cold environments.3–8 Although these measures are highly effective, cold injuries have continued to affect hundreds of service members each year because of exposure to cold and wet environments.9
The term cold injuries is used to describe injuries that have a central effect, such as hypothermia, as well as injuries that primarily affect the peripheries of the body, such as frostbite and immersion injuries. The human physiologic response to cold exposure is to retard heat loss and preserve core body temperature, but this response may not be sufficient to prevent hypothermia if heat loss is prolonged.9 Moreover, the response includes constriction of the peripheral (superficial) vascular system, which may result in non-freezing injuries or hasten the onset of actual freezing of tissues (frostbite).9
Hypothermia occurs when the core temperature of the body falls below 95°F.7 The most common mechanisms of accidental hypothermia are convective heat loss to cold air and conductive heat loss to water.10 Freezing temperatures are not required to produce hypothermia.10 In response to cold stress, peripheral blood vessels constrict and the hypothalamus stimulates heat production through shivering and elevated thyroid, adrenal, and catecholamine activity.10 The sympathetic nervous system mediates further vasoconstriction to minimize heat loss by reducing blood flow to the extremities, where the most cooling occurs.10 As the body’s basal metabolic rate decreases, core temperature falls, body functions slow down, and muscular and cerebral functions are impaired.10 Neurologic functioning begins declining even above a core body temperature of 95°F.11 Severe hypothermia can lead to pulmonary edema, reduced heart rate, coma, ventricular arrhythmias (including ventricular fibrillation), and asystole.10–12
Cold injuries affecting the body’s peripheries can be classified as freezing or non-freezing injuries.13 Freezing peripheral injury is defined as the damage sustained by tissues when exposed to temperatures below freezing.13 The tissue damage of frostbite is the result of both direct cold-induced cell death and the secondary effects of microvascular thrombosis and subsequent ischemia.14 Rapid freezing generally results in extra- and intracellular ice crystal formation.15 These crystals cause direct injury to cell membranes that results in cellular dehydration, lipid derangement, electrolyte fluxes as well as membrane lysis, and cell death;14–16 An inflammatory process follows, resulting in tissue ischemia and additional cell death.15 The initial cellular damage and the ensuing inflammatory processes are worsened with thawing of the affected area.15,16 With rewarming, edema from melting ice crystals leads to epidermal blister formation, and ischemia-reperfusion injury may be initiated;14–16 vasoconstriction and platelet aggregation caused by inflammatory mediators, prostaglandins, and thromboxane's exacerbate ischemia.17 The areas of the body most frequently affected by frostbite include the ears, nose, cheeks, chin, fingers, and toes.18,19 A substantial proportion of patients with peripheral frostbite experience permanent changes in their microcirculation and disruption of local neurological functions (e.g., reduced sensation in the affected area).19 Although most frostbite damage is minor, severe injury may lead to impaired functioning and ability to work because of cold hypersensitivity, chronic ulceration, vasospasm, localized osteoarthritis, and/or chronic pain.14,19
Non-freezing peripheral cold injury includes a spectrum of localized injuries to the soft tissues, nerves, and vasculature of distal extremities that result from prolonged exposure (12 to 48 hours) to wet, cold (generally 32 to 59°F) conditions; the injury process generally happens at a slower rate in warmer water.13,20 Although non-freezing peripheral cold injuries most often involve feet (immersion foot), any dependent body part can be affected by the condition, including the hands.21 Immersion foot generally presents as waterlogging of the feet, with the most marked effect occurring in the soles.17,20 The foot becomes hyperemic (increased blood flow), painful, and swollen with continuous exposure; progression to blistering, decreased blood flow, ulceration, and gangrene is gradual.17,20 Long-term complications of non-freezing cold injury such as immersion foot are similar to (e.g., hypersensitivity to cold, chronic pain) and as debilitating as (e.g., severe pain provoked by walking) those produced by frostbite.14,16,17,20
Factors that increase the risk of cold injuries include outdoor exposure, inadequate and/or wet clothing, cold water submersion, older age, exhaustion, dehydration, inadequate caloric intake, alcohol use, smoking (frostbite), previous cold injury (frostbite or immersion foot), chronic disease (e.g., peripheral vascular disease, diabetes), and medications that impair compensatory responses (e.g., oral antihyperglycemics, beta-blockers, general anesthetic agents).12–14,17–19 Situational factors that increase risk of immersion foot include immobility, wet socks, and constricting boots.17,22
Traditional measures to counter the dangers associated with cold environments include minimizing loss of body heat and protecting superficial tissues through such means as protective clothing, shelter, physical activity, and nutrition. However, military training or mission requirements in cold and wet weather may place service members in situations where they may be unable to be physically active, find warm shelter, or change wet or damp clothing.2–4
For the military, continuous surveillance of cold injuries is essential to inform steps to reduce their impact as well as to remind leaders of this predictable threat. Since 2004, the MSMR has published an annual update on the incidence of cold injuries that have affected U.S. military members during the 5 most recent cold seasons.23 This 2022 report addresses the occurrence of such injuries during the cold seasons from July 2017 through June 2022. The timing of the annual updates is intended to call attention to the recurring risks of such injuries as winter approaches in the Northern Hemisphere, where most members of the U.S. Armed Forces are assigned.
Methods
The surveillance period was 1 July 2017 through 30 June 2022. The surveillance population included all individuals who served in the active or reserve component of the U.S. Armed Forces at any time during the surveillance period. For analysis purposes, “cold years” or “cold seasons” were defined as 1 July through 30 June intervals so that complete cold weather seasons could be represented in year-to-year summaries and comparisons.
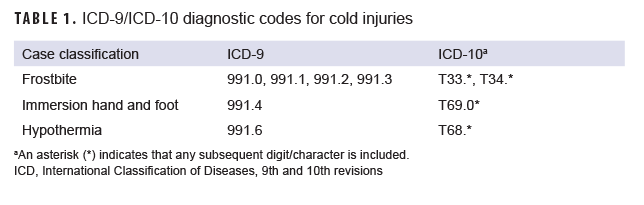
Because cold injuries represent a threat to the health of individual service members and to military training and operations, the U.S. Armed Forces require expeditious reporting of these reportable medical events (RMEs) via one of the service-specific electronic reporting systems; these reports are routinely incorporated into the Defense Medical Surveillance System (DMSS). For this analysis, the DMSS and the Theater Medical Data Store (which maintains electronic records of medical encounters of deployed service members) were searched for RMEs and inpatient and outpatient care for the diagnoses of interest: frostbite, immersion hand and foot, and hypothermia. A case was defined by the presence of an RME or one of any qualifying International Classification of Diseases, 9th or 10th revision (ICD-9 and ICD-10, respectively) code in the first diagnostic position of a record of a health care encounter (Table 1). The Department of Defense guidelines for RMEs require the reporting of cases of hypothermia, freezing peripheral injuries (i.e., frostbite), and non-freezing peripheral injuries (i.e., immersion injuries, chilblains).24 Cases of chilblains are not included in this report because the condition is common, infrequently diagnosed, usually mild in severity, and thought to have minimal medical, public health, or military impacts. Because of an update to the Disease Reporting System internet (DRSi) medical event reporting system in July 2017, the type of RMEs for cold injury (i.e., frostbite, immersion injury, hypothermia) could not be distinguished using RME records in DMSS data. Instead, information on the types of RME for cold injury between July 2017 and June 2022 were extracted from DRSi and then combined with DMSS data.
To estimate the number of unique individuals who suffered a cold injury each cold season and to avoid counting follow-up health care encounters after single episodes of cold injury, only 1 cold injury per individual per cold season was included. A slightly different approach was taken for summaries of the incidence of the different types of cold injury classifications, to include frostbite, immersion hand and foot, and hypothermia cases. To count these types of cold injuries, one of each type of cold injury per individual per cold season was included. For example, if an individual was diagnosed or reported with immersion hand and foot at 1 point during a cold season and then with frostbite later during the same cold season, each of those different types of injury would be counted in the tally of injuries. If a service member had multiple medical encounters for cold injuries on the same day, only 1 encounter was used for analysis (hospitalizations were prioritized over ambulatory visits, which were prioritized over RMEs).
Annual incidence rates of cold injuries among active component service members were calculated as incident cold injury diagnoses per 100,000 p-yrs of service. Annual rates of cold injuries among reservists were calculated as cases per 100,000 persons using the total number of reserve component service members for each year of the surveillance period. Counts of persons in the reserves were used as the denominator in these calculations because information on the start and end dates of active duty service periods of reserve component members was not available.
The numbers of cold injuries were summarized by the locations at which service members were treated for these injuries as identified by the Defense Medical Information System Identifier (DMIS ID) recorded in the medical records of the cold injuries. Because such injuries may be sustained during field training exercises, temporary duty, or other instances for which a service member may not be located at his/her usual duty station, DMIS ID was used as a proxy for the location where the cold injury occurred.
Results
2021–2022 cold season
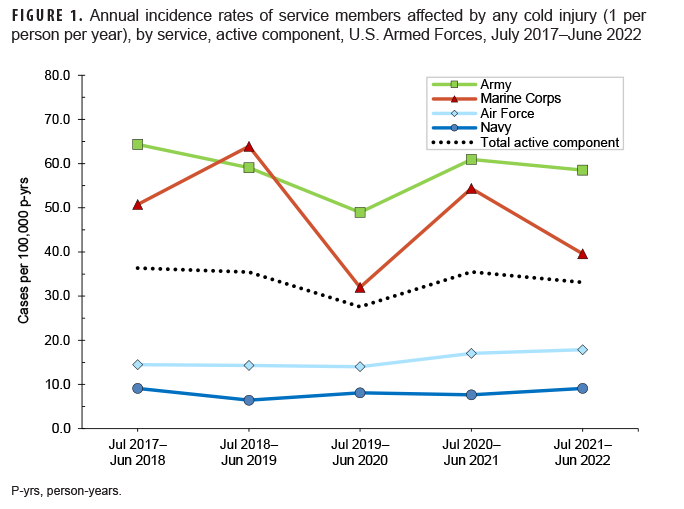
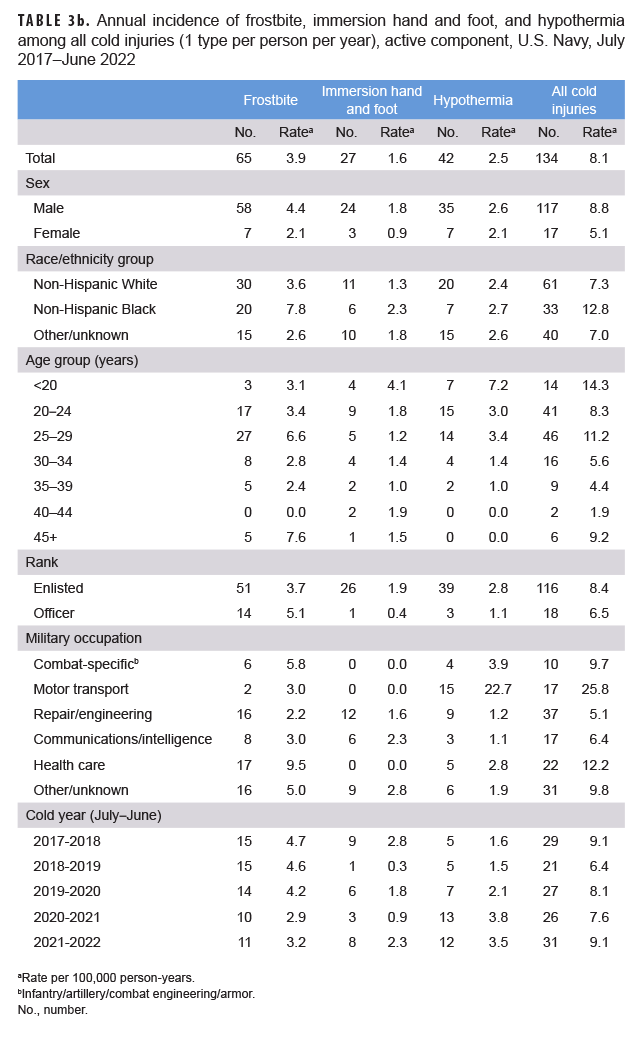
From July 2021 through June 2022 a total of 482 members of the active (n=435) and reserve (n=47) components had at least 1 cold injury (Table 2). Among the 435 active component cold injuries, 143 (32.9%) were reported as RMEs (data not shown). The Army contributed nearly two-thirds (63.4%; n=276) of active component service members affected by any cold injury during the 2021–2022 cold season; across the services during this period, active component Army members had the highest rate of any cold injury (58.5 per 100,000 p-yrs). Active component Marine Corps members had the second highest cold injury rate during the 2021–2022 cold season (39.6 per 100,000 p-yrs). Navy service members (n=31) had the lowest service-specific rate of any cold injury during the 2021–2022 cold season (9.1 per 100,000 p-yrs) (Table 2, Figure 1).
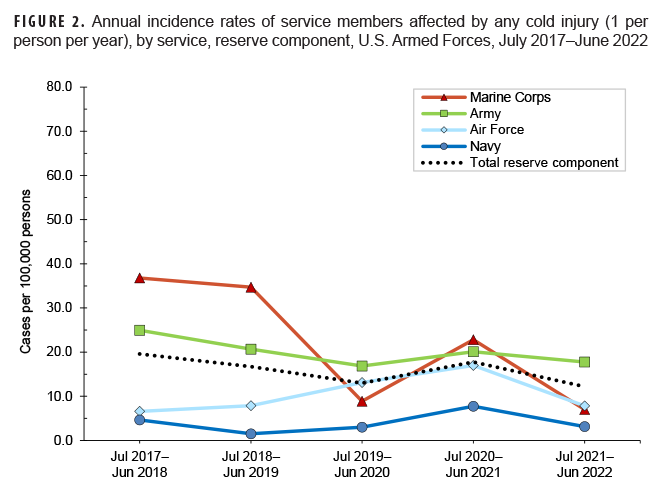
Army personnel (n=36) accounted for three-quarters (76.6%) of all reserve component service members (n=47) affected by cold injuries during 2021–2022 (Table 2). Service-specific annual rates of cold injuries among reserve component members were highest among those in the Army (17.8 per 100,000 persons) and lowest among those in the Navy (3.2 per 100,000 persons) (Figure 2).
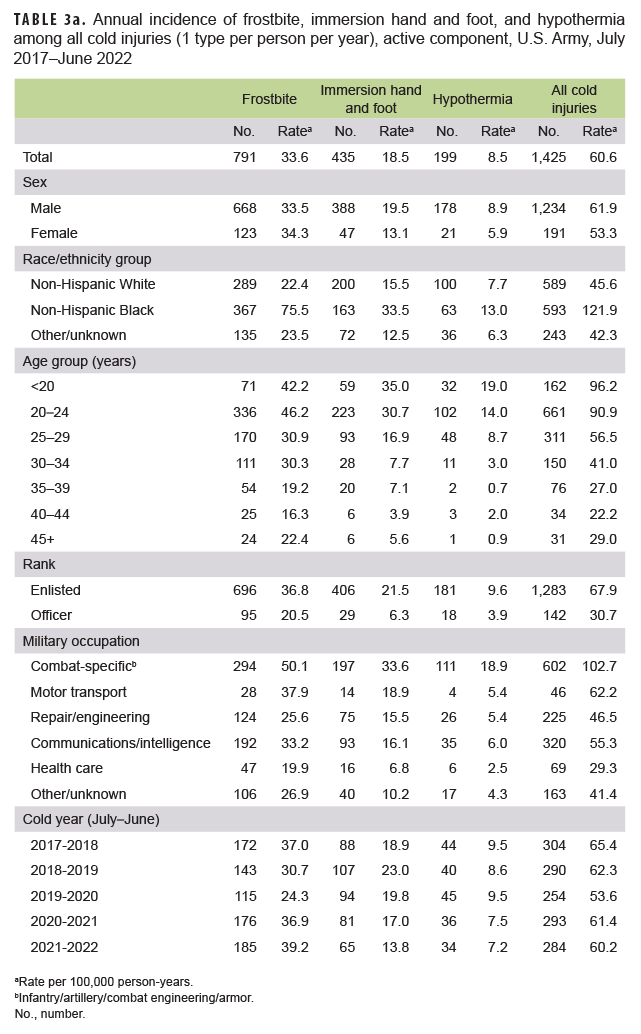
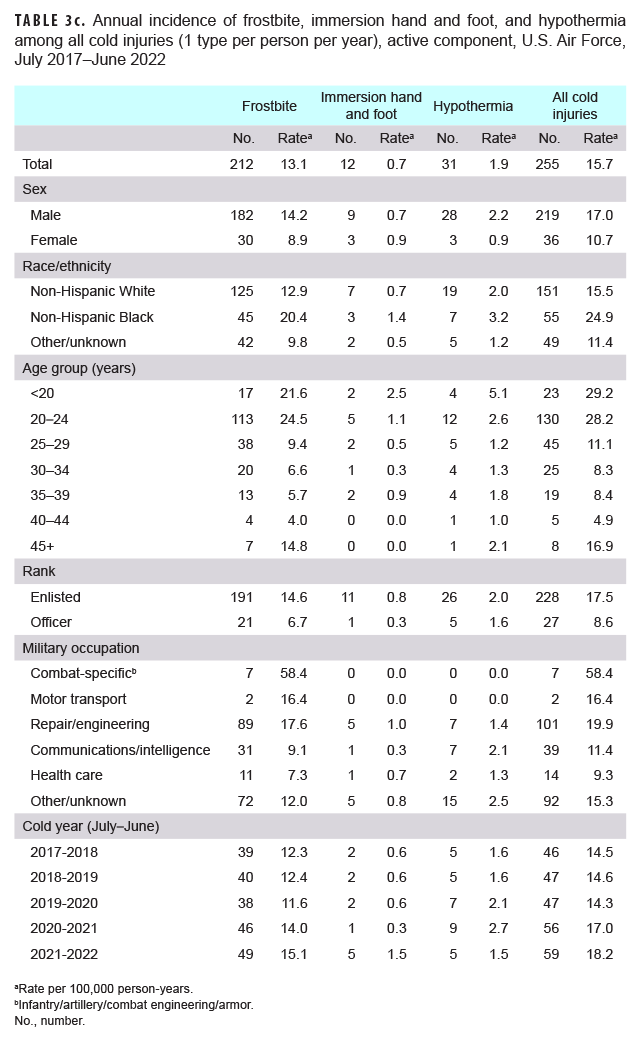
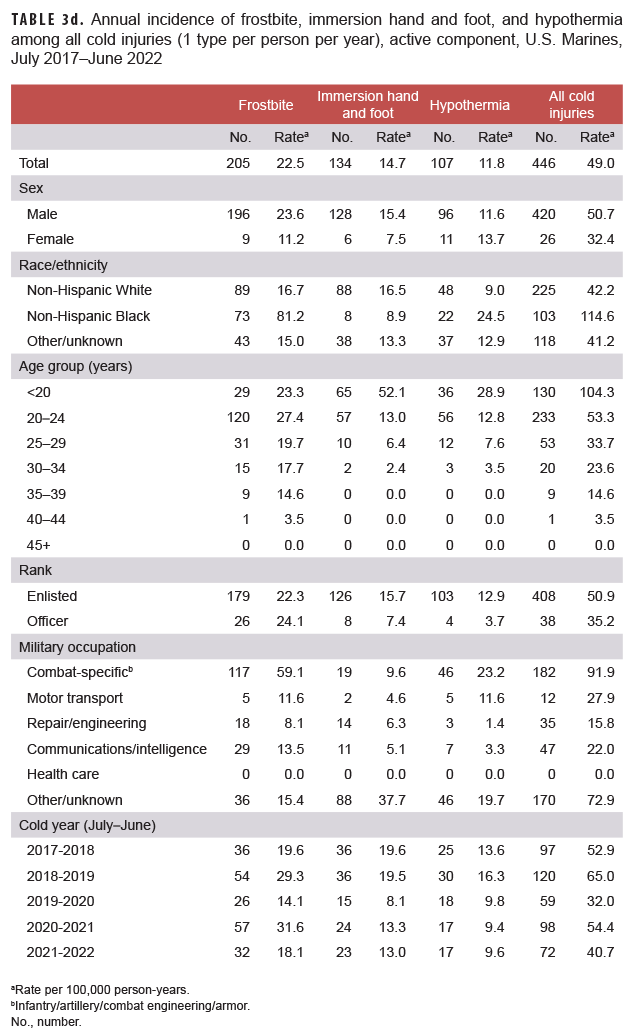
When the major types of cold injury case classifications were considered, not just the numbers of individuals affected, frostbite was the most common type of cold injury (n=277; 62.1% of all cold injuries) among active component service members in 2021–2022 (Tables 3a–3d). In the Air Force during the 2021–2022 season, 83.1% of all cold injuries were frostbite, whereas the proportions in the Army (65.1%), Marine Corps (44.4%), and Navy (35.5%) were much lower. For all active component service members during 2021–2022, the proportions of total cold injuries that were hypothermia and immersion injuries were 15.2% and 22.6%, respectively (Tables 3a–3d). Among active component Air Force members, the numbers and rates of frostbite and immersion hand and foot injuries in the 2021–2022 cold season were the highest of the past 5 years, while the number and rate of hypothermia cases were the lowest during this period (Table 3c). Among active component Army members, the numbers and rates of hypothermia and immersion foot injuries in the 2021–2022 cold season were the lowest of the 5-year period (Table 3a).
Five cold seasons: July 2017–June 2022
The crude overall incidence rate of cold injury for all active component service members in 2021–2022 (33.1 per 100,000 p-yrs) was 7.3% lower than the rate for the 2020–2021 cold season (35.5 per 100,000 p-yrs.) (Table 2, Figure 1). Throughout the surveillance period, the cold injury rates were consistently higher among active component members of the Army and the Marine Corps than among those in the Air Force and Navy (Figure 1). In 2021–2022, the service-specific incidence rate for active component Army members (60.2 per 100,000 p-yrs) was similar to the 2020–2021 Army rate (61.4 per 100,000 p-yrs.). For the Marine Corps, the active component rate for 2021–2022 decreased 25.1% between the 2020–2021 season and the 2021–2022 season. Service-specific annual rates of cold injuries among reserve component members were consistently higher among those in the Army than among those in the Air Force or the Navy (Figure 2). As was true for active component Marine Corps members, the 2021–2022 rate of cold injuries among reserve component Marine Corps members was lower (69.3%) than the rate for the previous season.
During the 5-year surveillance period, the rates of cold injuries among members of the active components of the Navy, Air Force, and Marine Corps were higher among male than female service members (Tables 3a–3d). Among active component members in the Navy, Air Force, and Marine Corps, the overall rates among male service members were 1.6 to 1.7 times the rates among female service members. During 2017–2022, female service members in the Army, Navy, and Marine Corps had lower rates of immersion foot than did male service members. With the exception of the Army, female service members also had lower rates of frostbite; with the exception of the Marine Corps, female service members had lower rates of hypothermia (Tables 3a–3d). For active component service members in all 4 services combined, the overall rate of cold injury was 50.0% higher among male service members (36.6 per 100,000 p-yrs) than among female service members (24.4 per 100,000 p-yrs.) (data not shown).
In all of the services, overall rates of cold injuries were higher among non-Hispanic Black service members than among those of the other race/ethnicity groups. In particular, within the Marine Corps and Army and for all services combined, rates of cold injuries were more than twice as high among non-Hispanic Black service members as rates among either non-Hispanic White service members or those in the “other/unknown” race/ethnicity group (Tables 3a–3d). The major underlying factor in these differences is that rates of frostbite among non-Hispanic Black members from all services combined was more than 3 times that of the other race/ethnicity groups, with the biggest differences apparent in the Marine Corps (more than 5 times) and the Army (more than 3 times) (data not shown). Additionally, across the active components of all services during 2017–2022, non-Hispanic Black service members had incidence rates of cold injuries greater than the rates of other race/ethnicity groups in nearly every military occupational category (data not shown).
Across the services, rates of cold injuries were highest among the youngest service members and tended to decrease with increasing age (Tables 3a–3d). Enlisted members of all 4 services had higher rates than officers. In the Army, Air Force, and Marine Corps, rates of all cold injuries combined were highest among service members in combat-specific occupations (infantry/artillery/combat engineering/armor) (Tables 3a, 3c–3d). For active component Navy members, rates of cold injuries during the 5-year period were highest among those in motor transport occupations (Table 3b).
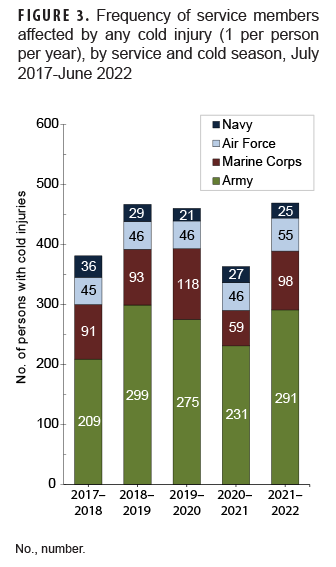
During the 5-year surveillance period, the majority of cold injuries occurred among active component service members (n=2,197; 87.5%), with 315 cold injuries (12.5%) occurring among the reserve component. Of all reserve component cold injuries, 67.3% (n=212) were members of the Army (Table 2). Overall, soldiers accounted for more than three-fifths (63.1%) of all cold injuries affecting active and reserve component service members (Table 2, Figure 3).
Of all active component cold injury cases presented in this report over the 5-year surveillance period (n=2,197), 105 (4.8% of the total) were affected during basic training. The Army (n=39) and Marine Corps (n=61) accounted for 95.2% of all basic trainees affected by cold injuries (data not shown). Additionally, during the surveillance period 64 service members (2.9% of the total) were hospitalized, and the vast majority (89.1%) of these hospitalized cold injury cases were members of either the Army (n=43) or Marine Corps (n=14) (data not shown). The majority of active component service members affected by cold injury were identified from diagnostic codes; just 30.2% (n=664) were classified from RMEs (data not shown).
Cold injuries during deployments
During the 5-year surveillance period, a total of 75 cold injuries were identified in service members deployed outside of the U.S. (data not shown). Of these, 39 (52.0%) were frostbite, 25 (33.3%) were immersion injuries, and 11 (14.7%) were hypothermia. Of these 75 cold injuries, slightly more than one-sixth (17.3%) occurred in the most recent cold season (n=13). There were 11 cold injuries during the 2020–2021 cold season, 10 during 2019–2020, 24 during 2018–2019, and 17 during 2017–2018 (data not shown). Frostbite injuries accounted for more than two-thirds (n=9; 69.2%) of the cold injuries identified in service members deployed outside of the U.S during the 2021–2022 cold season.
Cold injuries by location
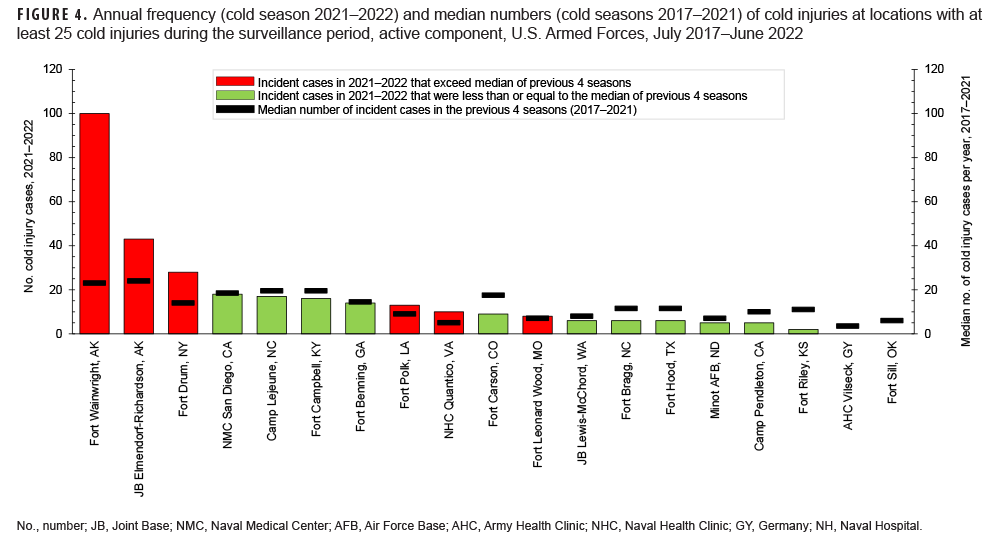
During the 5-year surveillance period, 19 military locations had at least 25 incident cold injuries (1 per person per year) among active and reserve component service members (Figure 4). Among these locations, those with the highest 5-year counts of incident injuries were Fort Wainwright, AK (n=208); Joint Base Elmendorf-Richardson, AK (n=203); Fort Campbell, KY (n=104); Camp Lejeune, NC (n=101); Fort Drum, NY (n=93); Naval Medical Center San Diego, CA (n=82); Fort Carson, CO (n=77); and Fort Benning, GA (n=76) (data not shown). During the 2021–2022 cold season, the numbers of incident cases of cold injuries were higher than the counts for the previous 2020–2021 cold season at 6 of the 19 locations (data not shown). The most noteworthy increase was observed at the Army’s Fort Wainwright, where there were 100 total cases identified in 2021–2022, compared to 42 the year before (data not shown). Figure 4 shows the numbers of cold injuries during 2021–2022 and the median numbers of cases for the previous 4 years at those locations that had at least 25 cases during the surveillance period. For 13 of the 19 installations, the numbers of cases in 2021–2022 were less than the median counts for the previous 4 years (Figure 4).
Editorial Comment
The overall rate of cold injuries in 2021–2022 decreased slightly compared to the previous cold year. As in previous years, cold injury rates were much higher among members of the Army and Marine Corps.
In 2021–2022, frostbite was the most common type of cold injury among active component service members in all 4 of the services. Factors associated with increased risk of cold injury in previous years were again noted during the most recent cold season. Compared to their respective counterparts, overall rates of cold injuries were higher among male service members, non-Hispanic Black service members, the youngest (less than 20 years old), and those who were enlisted. Increased rates of cold injuries affected nearly all enlisted and officer occupations among non-Hispanic Black service members. Of note, rates of frostbite were markedly higher among non-Hispanic Blacks compared to non-Hispanic Whites and those in the other/unknown race/ethnicity group. These differences have been noted in prior MSMR updates, and the results of several studies suggest that other factors such as physiologic differences are possible explanations for increased susceptibility.9,14,25–27 The numbers of cold injuries associated with deployments during 2020–2021 and 2021–2022 were the lowest numbers during the 5-year surveillance period; frostbite injuries accounted for the majority of the cold injuries in service members deployed outside of the U.S. during the 2021–2022 cold season.
It should be noted that this analysis of cold injuries was unable to distinguish between injuries sustained during official military duties (training or operations) and injuries associated with personal activities not related to official duties. RMEs for non-freezing peripheral injuries were excluded if “chilblains” was listed in the case comments; however, there may have been some RMEs for chilblains that were misclassified as immersion injury if chilblains were not listed in the case comments. To provide for all circumstances that pose the threat of cold injury, service members should know the signs of cold injury well and how to protect themselves against such injuries whether they are training, operating, fighting, or recreating under wet and freezing conditions.
The most current cold injury prevention materials are available at: https://phc.amedd.army.mil/topics/discond/cip/Pages/Cold-Weather-Casualties-and-Injuries.aspx.
References
- Candler WH, Freedman MS. Military medical operations in cold environments. In: Pandolf KB, Burr RE, eds. Medical Aspects of Harsh Environments, Volume 1. Falls Church, VA: Office of the Surgeon General; 2001:553-566.
- Paton BC. Cold, casualties, and conquests: the effects of cold on warfare. In: Pandolf KB, Burr RE, eds. Medical Aspects of Harsh Environments, Volume 1. Falls Church, VA: Office of the Surgeon General; 2001:313-349.
- Pozos RS (ed.). Section II: cold environments. In: Pandolf KB, Burr RE, eds. Medical Aspects of Harsh Environments, Volume 1. Falls Church, VA: Office of the Surgeon General;2001:311-566.
- DeGroot DW, Castellani JW, Williams JO, Amoroso PJ. Epidemiology of U.S. Army cold weather injuries, 1980–1999. Aviat Space Environ Med. 2003;74(5):564-570.
- Headquarters, Department of the Army. Technical Bulletin Medical 508. Prevention and Management of Cold-Weather Injuries. 1 April 2005.
- Headquarters, Department of the Army, Training and Doctrine Command. TRADOC Regulation 350-29. Prevention of Heat and Cold Casualties. 18 July 2016.
- Headquarters, Department of the Army, Training and Doctrine Command. TRADOC Regulation 350-6. Enlisted Initial Entry Training Policies and Administration. 9 August 2019.
- Castellani JW, O’Brien C, Baker-Fulco C, Sawka MN, Young AJ. Sustaining health and performance in cold weather operations. Technical Note TN/02-2. Natick, MA: U.S. Army Research Institute of Environmental Medicine; October 2001.
- Armed Forces Health Surveillance Branch. Update: Cold weather injuries, active and reserve component, U.S. Armed Forces, July 2013–June 2018. MSMR. 2018;25(11):10-17.
- Jolly BT, Ghezzi KT. Accidental hypothermia. Emerg Med Clin North Am. 1992;10(2):311-327.
- Rischall ML, Rowland-Fisher A. Evidence-based management of accidental hypothermia in the emergency department. Emerg Med Pract. 2016;18(1):1-18
- Biem J, Koehncke N, Classen D, Dosman J. Out of the cold: management of hypothermia and frostbite. CMAJ. 2003;168(3):305-311.
- Imray CH, Oakley EH. Cold still kills cold-related illnesses in military practice freezing and non-freezing cold injury. J R Army Med Corps. 2005;151(4):218-222.
- Handford C, Thomas O, Imray CHE. Frostbite. Emerg Med Clin North Am. 2017;35(2):281-299.
- Murphy JV, Banwell PE, Roberts AH, McGrouther DA. Frostbite: pathogenesis and treatment. J Trauma. 2000;48(1):171-178.
- Petrone P, Kuncir EJ, Asensio JA. Surgical management and strategies in the treatment of hypothermia and cold injury. Emerg Med Clin North Am. 2003;21(4):1165-1178.
- Imray C, Grieve A, Dhillon S, Caudwell Xtreme Everest Research Group. Cold damage to the extremities: frostbite and non-freezing cold injuries. Postgrad Med J. 2009;85(1007):481-488.
- Harirchi I, Arvin A, Vash JH, Zafarmand V. Frostbite: incidence and predisposing factors in mountaineers. Br J Sports Med. 2005;39(12):898-901.
- Ervasti O, Hassi J, Rintamaki H, et al. Sequelae of moderate finger frostbite as assessed by subjective sensations, clinical signs, and thermophysiological responses. Int J Circumpolar Health. 2000;59(2):137-145.
- Hall A, Sexton J, Lynch B, et al. Frostbite and immersion foot care. Mil Med. 2018;183(suppl 2):168-171.
- McMahon JA, Howe A. Cold weather issues in sideline and event management. Curr Sports Med Rep. 2012;11(3):135-141.
- Centers for Disease Control and Prevention. Natural disasters and severe weather: trench foot or immersion foot. https://www.cdc.gov/disasters/trenchfoot.html. Accessed 7 October 2019.
- Army Medical Surveillance Activity. Cold injuries, active duty, U.S. Armed Forces, July 1999–June 2004. MSMR. 2004;10(5):2-10.
- Armed Forces Health Surveillance Branch. Armed Forces Reportable Events Guidelines and Case Definitions, 2020. https://health.mil/Reference-Center/Publications/2020/01/01/Armed-Forces-Reportable-Medical-Events-Guidelines. Accessed 14 October 2022.
- Burgess JE, Macfarlane F. Retrospective analysis of the ethnic origins of male British Army soldiers with peripheral cold weather injury. J R Army Med Corps. 2009;155(1):11-15.
- Maley MJ, Eglin CM, House JR, Tipton MJ. The effect of ethnicity on the vascular responses to cold exposure of the extremities. Eur J Appl Physiol. 2014;114(11):2369-2379.
- Kuht JA, Woods D, Hollis S. Case series of non-freezing cold injury: Epidemiology and risk factors. J R Army Med Corps. 2018; pii: jramc-2018-000992.