Skip main navigation

Military Health System

Clear Your Browser Cache

This website has recently undergone changes. Users finding unexpected concerns may care to clear their browser's cache to ensure a seamless experience.

Surveillance Snapshot: Trends in Opioid Prescription Fills Among U.S. Military Service Members During Fiscal Years 2007–2017

Image of U.S. Air Force Tech Sgt. Ryan Marr, 18th Medical Group pharmacy craftsman, processes prescriptions, June 8, 2018, at Kadena Air Base, Japan. The pharmacy processes and fills prescriptions for hundreds of different medical needs. (U.S. Air Force photo by Staff Sergeant Jessica H. Smith) Merriam/Released). U.S. Air Force Tech Sgt. Ryan Marr, 18th Medical Group pharmacy craftsman, processes prescriptions, June 8, 2018, at Kadena Air Base, Japan. The pharmacy processes and fills prescriptions for hundreds of different medical needs. (U.S. Air Force photo by Staff Sergeant Jessica H. Smith) Merriam/Released)

This snapshot highlights unadjusted metrics of opioid prescription fills among active duty and retired service members using data from the Pharmacy Data Transaction Service of the Military Health System (MHS). The metrics described include

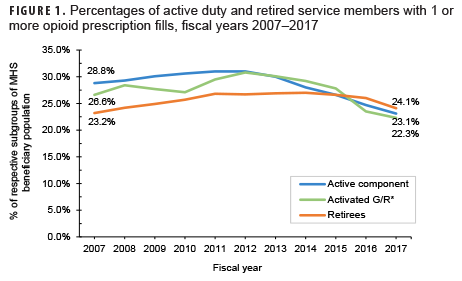
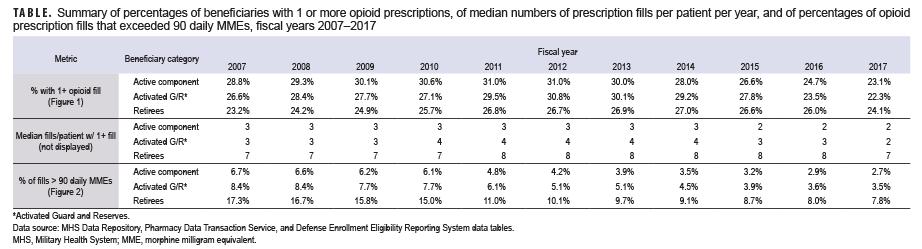
  • the percentage of active component, reserve component, and military retirees who filled at least 1 opioid prescription (therapeutic class = opiate agonist) in a given year (Figure 1, Table);
  • the median number of fills per year among those with at least 1 fill (Table); and
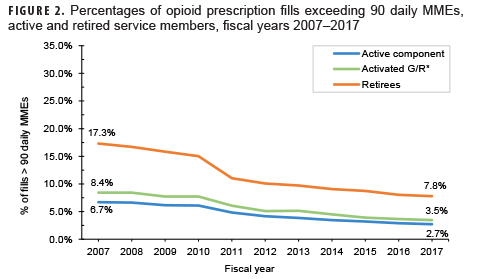
  • the percentage of opioid fills that exceeded 90 daily morphine milligram equivalents (MMEs) (Figure 2).a

Despite decreasing fill rates in recent years, nearly 1 in 4 active duty and retired service members had a filled opioid prescription in 2017 (Figure 1). Active duty and activated Guard/Reserve members who received an opioid prescription had a median of 2 fills per patient in 2017, while retirees had a median of 7 fills per patient (Table). Moreover, a higher percentage of retirees' opioid prescriptions were for high-dose prescriptions (as determined by MMEs)1,2 compared to active duty and activated Guard/Reserve, although rates were not adjusted for age (Figure 2). While increased duration and prescriptions greater than 90 MME per day are not necessarily problematic in and of themselves, both are risk factors for potential misuse and may be indicators of potentially concerning prescribing practices.3 These findings highlight the importance of tracking opioid fills in the MHS, monitoring patients with opioid prescriptions, expanding surveillance efforts to assess prescription practices, and limiting opportunities for opioid misuse and abuse. Despite substantial rates of opioid prescription fills, opioid use disorders are diagnosed infrequently among service members in the MHS (0.2% prevalence from 2010–2015).4 It is important to emphasize and sustain initiatives such as the Defense Health Agency's Opioid Prescriber Safety Training Program as well as regulatory guidance5 aimed at facilitating the responsible use of this important facet of pain management.

aDaily MME = (strength per unit) x (number of units/days' supply) x (MME conversion factor).1,2,5

Author affiliations: Psychological Health Center of Excellence, J-9 Research and Development Directorate of the Defense Health Agency (Mr. Peters, Dr. Kincaid, Ms. Quah, Ms. Greenberg, Dr. Curry); Salient CRGT, Inc. (Mr. Peters, Dr. Kincaid, Ms. Quah, Ms. Greenberg)

References

  1. Centers for Disease Control and Prevention. Opioid oral morphine milligram equivalent (MME) conversion factors. https://www.cms.gov/Medicare/Prescription-Drug-Coverage/PrescriptionDrugCovContra/Downloads/Opioid-Morphine-EQ-Conversion-Factors-Aug-2017.pdf. Accessed 24 June 2019.
  2. Centers for Disease Control and Prevention. Calculating total daily dose of opioids for safer dosage. https://www.cdc.gov/drugoverdose/pdf/calculating_total_daily_dose-a.pdf. Accessed 24 June 2019.
  3. Centers for Disease Control and Prevention. Vital signs: opioid prescribing. https://www.cdc.gov/vitalsigns/pdf/2017-07-vitalsigns.pdf. Published July 2017. Accessed 24 June 2019.
  4. Office of the Secretary of Defense. Report to Congress on prescription drug abuse. https://health.mil/Reference-Center/Reports/2016/04/15/Prescription-Drug-Abuse. Published March 2016. Accessed 24 June 2019
  5. Defense Health Agency. Procedural Instruction 6025.04. Pain Management and Opioid Safety in the MHS. 8 June 2018.

Percentages of active duty and retired service members with 1 or more opioid prescription fills, fiscal years 2007–2017

Percentages of opioid prescription fills exceeding 90 daily MMEs, active and retired service members, fiscal years 2007–2017

Summary of percentages of beneficiaries with 1 or more opioid prescriptions, of median numbers of prescription fills per patient per year, and of percentages of opioid prescription fills that exceeded 90 daily MMEs, fiscal years 2007–2017

You also may be interested in...

Article
Jun 1, 2022

Hospitalizations, Active Component, U.S. Armed Forces, 2021

The hospitalization rate in 2021 was 48.0 per 1,000 person-years (p-yrs), the second lowest rate of the most recent 10 years. For hospitalizations limited to military facilities, the rate in 2021 was the lowest for the entire period. As in prior years, the majority (71.2%) of hospitalizations were associated with diagnoses in the categories of mental ...

Article
Jun 1, 2022

Absolute and Relative Morbidity Burdens Attributable to Various Illnesses and Injuries, Non-service Member Beneficiaries of the Military Health System, 2021

In 2021, mental health disorders accounted for the largest proportions of the morbidity and health care burdens that affected the pediatric and younger adult beneficiary age groups. Among adults aged 45–64 and those aged 65 or older, musculoskeletal diseases accounted for the most morbidity and health care burdens. As in previous years, this report ...

Article
Jun 1, 2022

Absolute and Relative Morbidity Burdens Attributable to Various Illnesses and Injuries, Active Component, U.S. Armed Forces, 2021

In 2021, as in prior years, the medical conditions associated with the most medical encounters, the largest number of affected service members, and the greatest number of hospital days were in the major categories of injuries, musculoskeletal disorders, and mental health disorders. Despite the pandemic, COVID-19 accounted for less than 2% of total ...

Article
Jun 1, 2022

Medical Evacuations out of the U.S. Central and U.S. Africa Commands, Active and Reserve Components, U.S. Armed Forces, 2021

The proportions of evacuations out of USCENTCOM that were due to battle injuries declined substantially in 2021. For USCENTCOM, evacuations for mental health disorders were the most common, followed by non-battle injury and poisoning, and signs, symptoms, and ill-defined conditions. For USAFRICOM, evacuations for non-battle injury and poisoning were ...

Article
Jun 1, 2022

Ambulatory Visits, Active Component, U.S. Armed Forces, 2021

In 2021, the overall numbers and rates of active component service member ambulatory care visits were the highest of any of the last 10 years. Most categories of illness and injury showed modest increases in numbers and rates. The proportions of ambulatory care visits that were accomplished via telehealth encounters fell to under 15% in 2021, compared ...

Article
May 1, 2022

The Association Between Two Bogus Items, Demographics, and Military Characteristics in a 2019 Cross-sectional Survey of U.S. Army Soldiers

NIANTIC, CT, UNITED STATES 06.16.2022 U.S. Army Staff Sgt. John Young, an information technology specialist assigned to Joint Forces Headquarters, Connecticut Army National Guard, works on a computer at Camp Nett, Niantic, Connecticut, June 16, 2022. Young provided threat intelligence to cyber analysts that were part of his "Blue Team" during Cyber Yankee, a cyber training exercise meant to simulate a real world environment to train mission essential tasks for cyber professionals. (U.S. Army photo by Sgt. Matthew Lucibello)

Data from surveys may be used to make public health decisions at both the installation and the Department of the Army level. This study demonstrates that a vast majority of soldiers were likely sufficiently engaged and answered both bogus items correctly. Future surveys should continue to investigate careless responding to ensure data quality in ...

Article
May 1, 2022

Update: Sexually Transmitted Infections, Active Component, U.S. Armed Forces, 2013–2021

This illustration depicts a 3D computer-generated image of a number of drug-resistant Neisseria gonorrhoeae bacteria. CDC/James Archer

This report summarizes incidence rates of the 5 most common sexually transmitted infections (STIs) among active component service members of the U.S. Armed Forces during 2013–2021. In general, compared to their respective counterparts, younger service members, non-Hispanic Black service members, those who were single and other/unknown marital status, ...

Article
Mar 1, 2022

Brief report: Using syndromic surveillance to monitor MIS-C associated with COVID-19 in Military Health System beneficiaries

Air Force 1st Lt. Anthony Albina, a critical care nurse assigned to Joint Base Andrews, Md., checks a patient’s breathing and heart rate during an intubation procedure while supporting COVID-19 response operations in Cleveland, Jan. 20, 2022.

SARS CoV-2 and the illness it causes, COVID-19, have exacted a heavy toll on the global community. Most of the identified disease has been in the elderly and adults. The goal of this analysis was to ascertain if user-built ESSENCE queries applied to records of outpatient MHS health care encounters are capable of detecting MIS-C cases that have not ...

Skip subpage navigation
Refine your search
Last Updated: July 11, 2023
Follow us on Instagram Follow us on LinkedIn Follow us on Facebook Follow us on X Follow us on YouTube Sign up on GovDelivery