What Are the New Findings?
In 2020, mental health disorders accounted for the largest proportions of the morbidity and health care burdens that affected the pediatric and younger adult beneficiary age groups. Among adults aged 45–64 years, musculoskeletal diseases accounted for the most morbidity and health care burdens, and among adults aged 65 years or older, cardiovascular diseases accounted for the most. As in previous years, the results of this analysis demonstrate that most health care services in the Military Health System are delivered to non-service member beneficiaries rather than to service members.
What Is the Impact on Readiness and Force Health Protection?
Illness and injury among military family member dependents may negatively impact service members' readiness and their focus on the mission by contributing to stress or by affecting the mental health status of the service member. The provision of health care services to non-service member beneficiaries is an important benefit that can improve military family readiness and, in turn, improve the overall readiness of the force.
Background
Individuals who are eligible for care through the Military Health System (MHS) ("beneficiaries") include active component service members and their eligible family members, activated National Guard and Reserve service members and their eligible family members, and retirees and their eligible family members. In fiscal year 2019, there were approximately 9.57 million beneficiaries eligible for health care in the MHS: 1.40 million active duty and activated reserve component service members, 1.66 million active duty family members, 190,000 Guard/Reserve members, 810,000 Guard/Reserve family members, and 5.51 million retirees and their family members.1 Some beneficiaries of MHS care do not enroll in the health care plans provided by the MHS (e.g., they use insurance through their own employment), and some of those who are enrolled do not seek care through the MHS.
MHS beneficiaries may receive care from resources provided directly by the Uniformed Services (i.e., military medical treatment facilities [MTFs]) or from civilian health care resources (i.e., outsourced [purchased] care) that supplement direct military medical care.1 In 2020, approximately 6.28 million non-service member beneficiaries utilized inpatient or outpatient services provided by the MHS (data source: the Defense Medical Surveillance System [DMSS]).
Since 1998, the MSMR has published annual summaries of the numbers and rates of hospitalizations and outpatient medical encounters to assess the health care burdens of 16 categories of illnesses and injuries among active component military members. Beginning in 2001, the MSMR complemented those summaries with annual reports on the combined health care burden of both inpatient and outpatient care for 25 categories of health care. Since then, the MSMR s annual burden issue has contained a report on hospital care, ambulatory care, and the overall burden of care each for active component service members. In 2014, for the first time and using similar methodology, the MSMR published a report that quantified the health care burden for illnesses and injuries among non-service members in calendar year 2013.2 The current report represents an update and provides a summary of care provided to non-service members in the MHS during calendar year 2020. Health care burden estimates are stratified by direct versus outsourced care and across 4 age groups of health care recipients.
Methods
The surveillance period was 1 Jan. through 31 Dec. 2020. The surveillance population included all non-service member beneficiaries of the MHS who had at least 1 hospitalization or outpatient medical encounter during 2020 either through a military medical facility/ provider or a civilian facility/provider (if paid for by the MHS). For this analysis, all inpatient and outpatient medical encounters were summarized according to the primary (first-listed) diagnoses documented on administrative records of the encounters if the diagnoses were reported with International Classification of Diseases, 10th Revision (ICD-10) codes that indicate the natures of illnesses or injuries (i.e., ICD10 codes A00–T88). Nearly all records of encounters with first-listed diagnoses that were Z-codes (care other than for a current illness or injury—e.g., general medical examinations, after care, vaccinations) or V/W/X/Y-codes (indicators of the external causes but not the natures of injuries) were excluded from the analysis; however, encounters with primary diagnoses of Z37 ("outcome of delivery, single liveborn") were retained.
For summary purposes, all illness- and injury-specific diagnoses (as defined by the ICD-10) were grouped into 153 burden of disease-related conditions and 25 major categories based on a modified version of the classification system developed for the Global Burden of Disease Study.3 The methodology for summarizing absolute and relative morbidity burdens vs described on page 2 of this issue of the MSMR. Results were stratified by source of health care (direct [military treatment facilities] vs outsourced [non-military medical facilities]) and by age group (0–17 years, 18–44 years, 45–64 years, and 65 years or older). For the purposes of the analysis of morbidity burdens within the youngest age group, developmental disorders were classified as mental health disorders.
Results
In the population of non-service member MHS care recipients in 2020, there were more females (56.9%) than males (43.1%); more infants, children, and adolescents (those younger than 20 years old: n=1.49 million; 23.8%) and more seniors (those aged 65 years or older: n=2.07 million; 33.0%) than younger (aged 20–44 years: n=1.27 million; 20.3%) or older (aged 45–64 years: n=1.45 million; 23.0%) adults (data not shown)
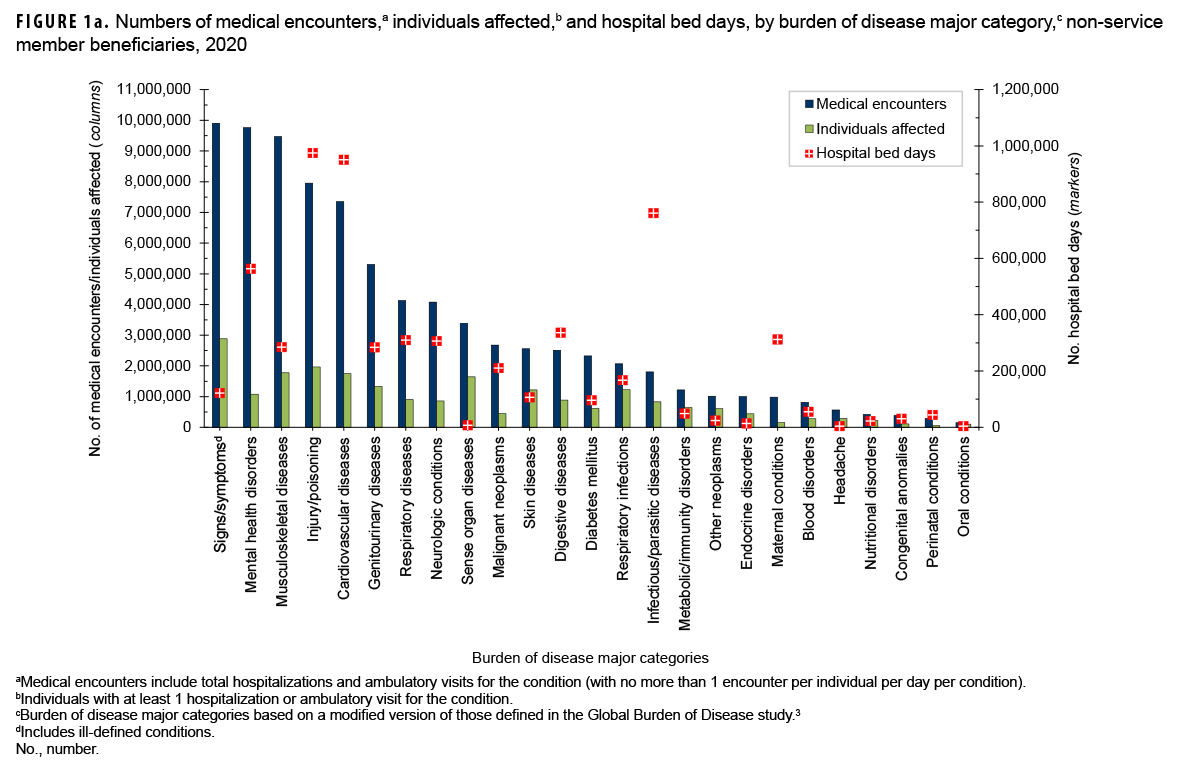
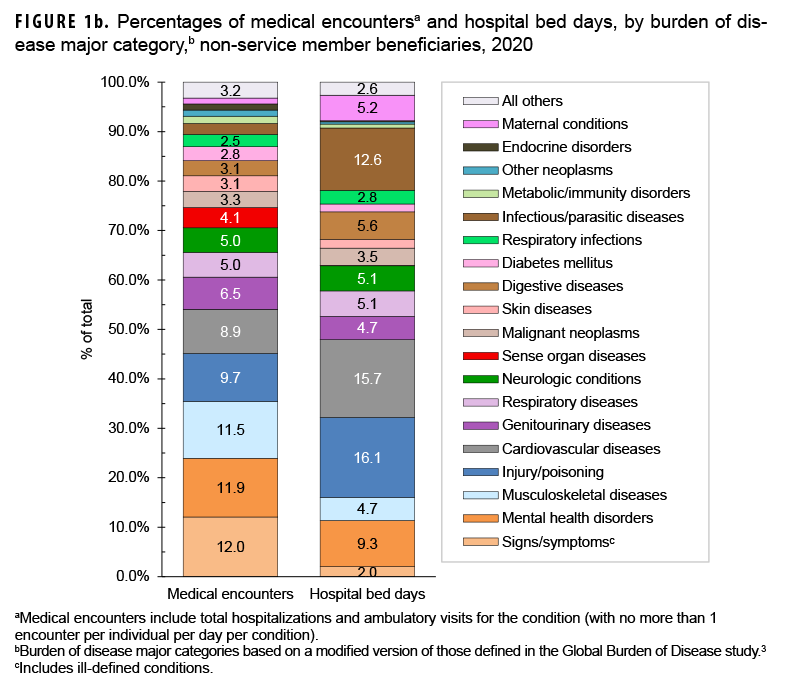
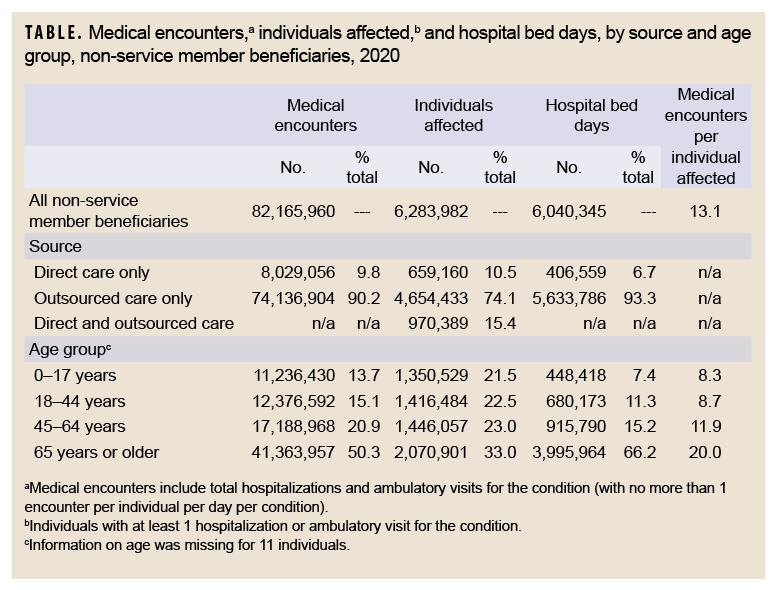
In 2020, a total of 6,283,982 non-service member beneficiaries of the MHS had 82,165,960 medical encounters (Table). Thus, on average, each individual who accessed care from the MHS had 13.1 medical encounters over the course of the year. The top 3 morbidity-related categories, which accounted for more than one-third (35.5%) of all medical encounters, were signs/symptoms and ill-defined conditions (12.0%), mental health disorders (11.9%), and musculoskeletal diseases (11.5%) (Figures 1a, 1b). The illness/injury categories that affected the most beneficiaries who received any care were signs/symptoms and ill-defined conditions (45.9%), injury/poisoning (31.3%), and musculoskeletal diseases (28.2%).
Injury/poisoning accounted for more hospital bed days (n=974,618) than any other illness/injury category and 16.1% of all hospital bed days overall (Figures 1a, 1b). An additional 43.2% of all bed days were attributable to cardiovascular diseases (15.7%), infectious/parasitic diseases (12.6%), mental health disorders (9.3%), and digestive diseases (5.6%).
Of note, among all non-service member beneficiaries in 2020, maternal conditions (including pregnancy complications and delivery) accounted for relatively more hospital bed days (n=312,268; 5.2%) than individuals affected (n=158,558; 2.5%) (Figure 1a).
Click to closeDirect CareDirect care refers to military hospitals and clinics, also known as “military treatment facilities” and “MTFs.”Direct care vs. outsourced care
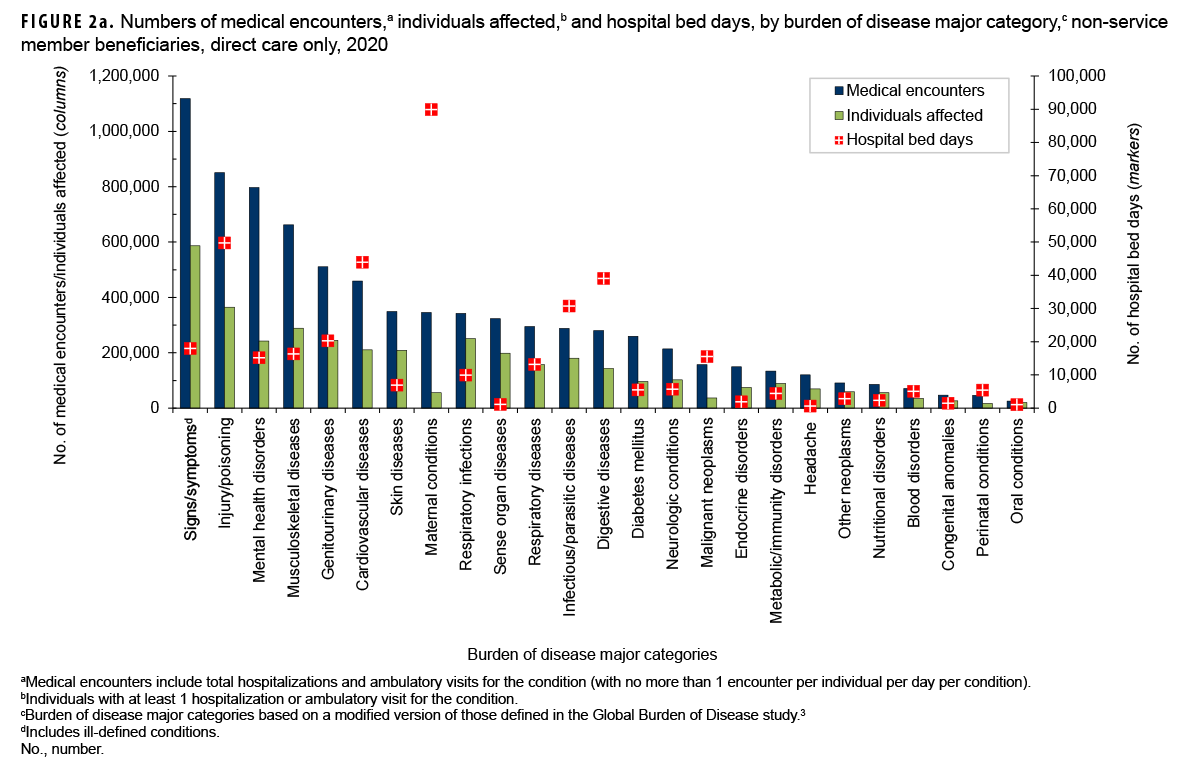
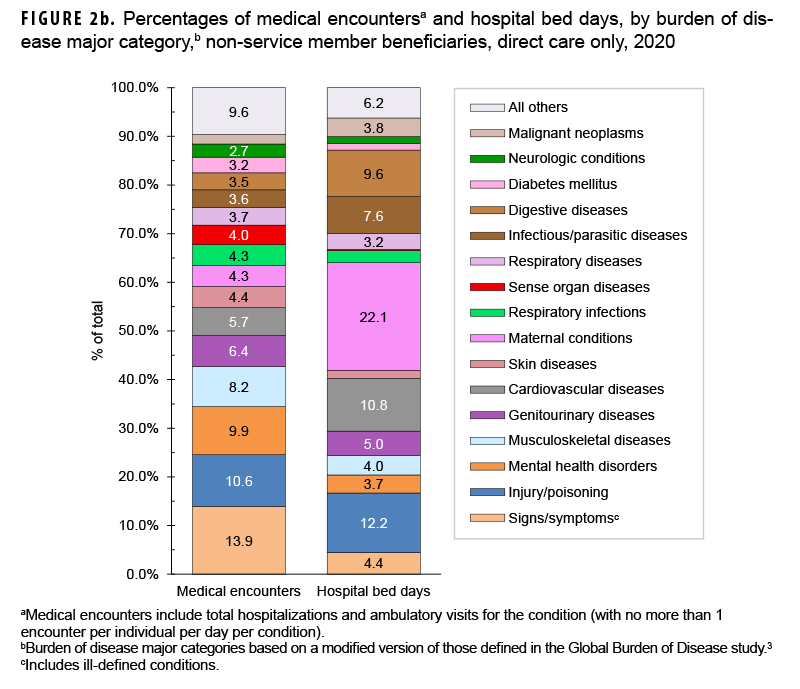
In 2020, among non-service member beneficiaries, most medical encounters (90.2%) were in non-military medical facilities (outsourced care) (Table). Of all beneficiaries with any illness- or injury-related encounters during the year, many more received exclusively outsourced care (n=4,654,433; 74.1%) than either military medical (direct) care only (n=659,160; 10.5%) or both outsourced and direct care (n=970,389; 15.4%). By far, most inpatient care (93.3% of all bed days) was received in non-military facilities.
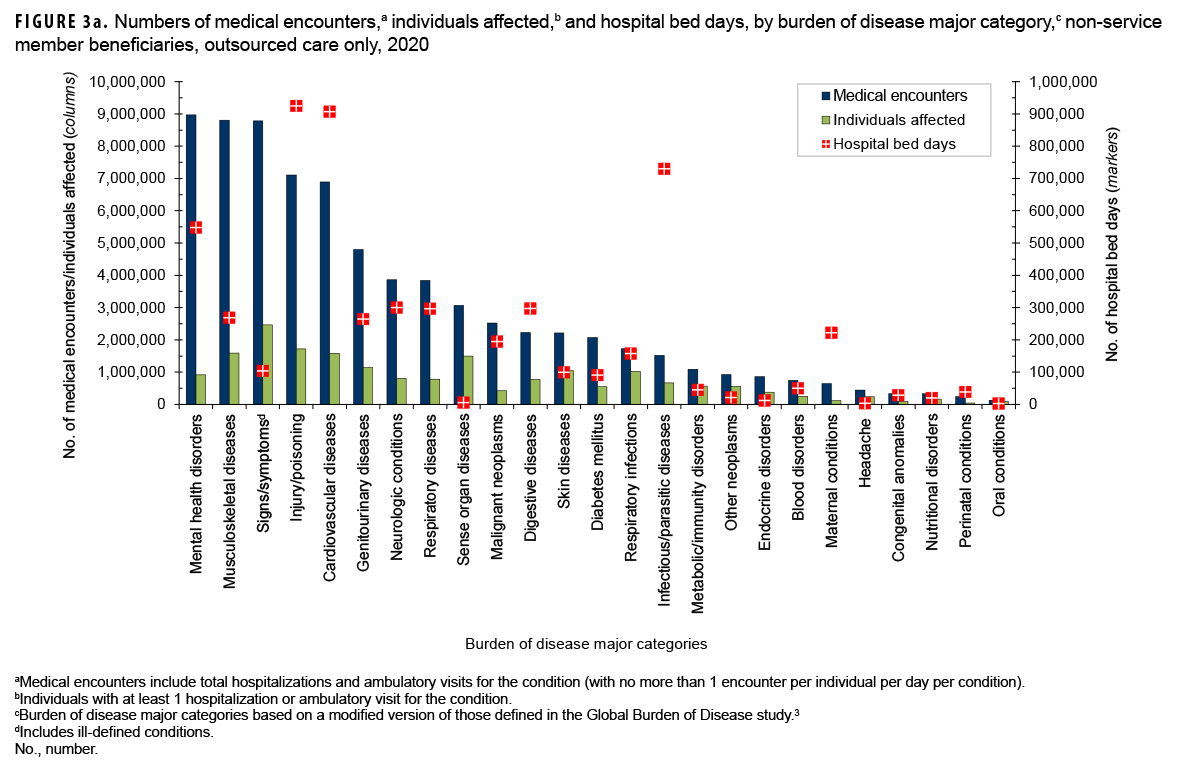
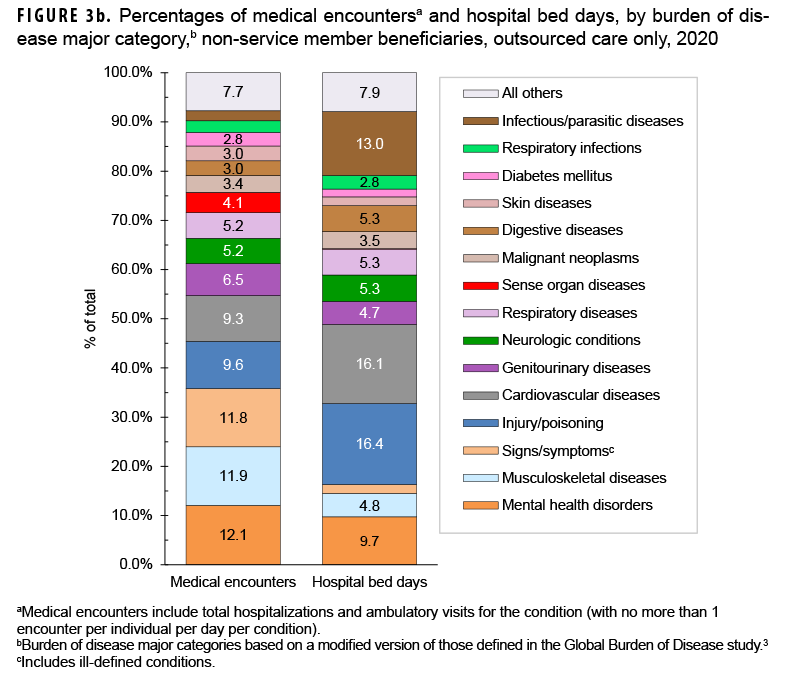
The proportions of medical encounters by morbidity-related categories were broadly similar for direct and outsourced care (Figures 2a, 2b, 3a, 3b). However, encounters for musculoskeletal diseases, cardiovascular diseases, and neurological conditions were relatively more common in outsourced (11.9%, 9.3%, and 5.2%, respectively) compared to direct (8.2%, 5,7%, and 2.7%, respectively) care.
Maternal conditions accounted for 22.1% of all direct care bed days but only 3.9% of all outsourced care bed days (Figures 2a, 2b, 3a, 3b). However, mental health disorders, infectious/parasitic diseases, cardiovascular diseases, injury/poisoning, and neurologic conditions accounted for relatively more of all outsourced than direct care bed days (% of outsourced vs. % of direct care bed days: mental health disorders, 9.7% vs. 3.7%; infectious/parasitic diseases, 13.0%, 7.6%; cardiovascular, 16.1% vs. 10.8%; injury/poisoning, 16.4%, 12.2%; neurologic conditions, 5.3% vs. 1.4%).
Pediatric beneficiaries (aged 0–17 years)
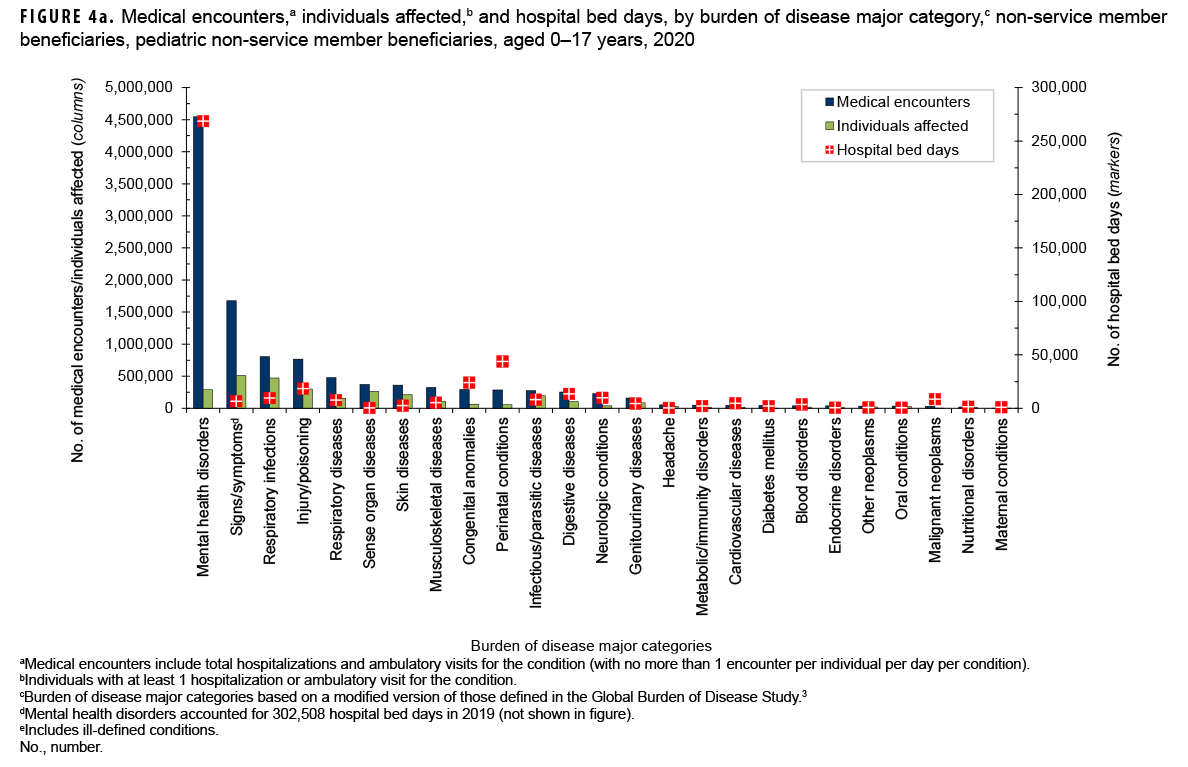
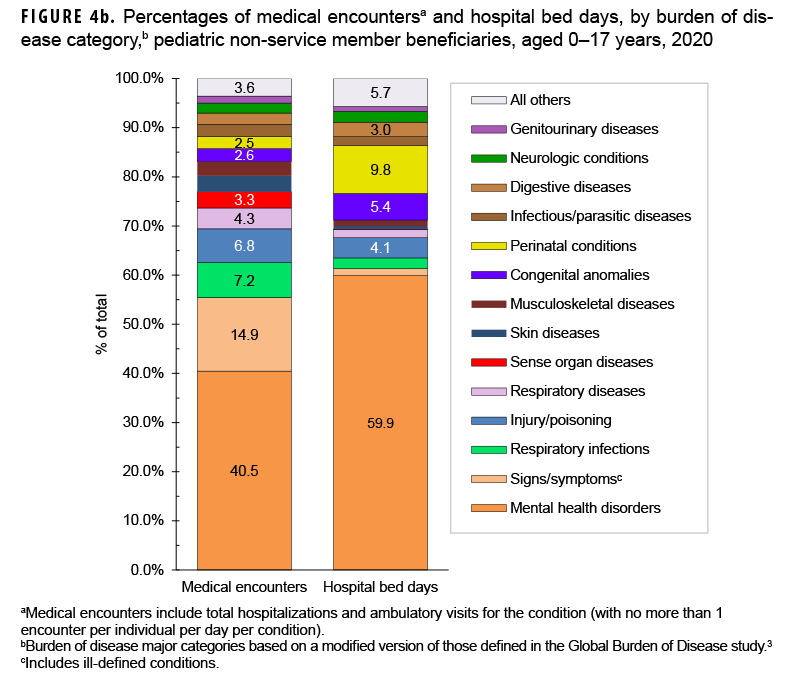
In 2020, pediatric beneficiaries accounted for 13.7% of all medical encounters, 21.5% of all individuals affected, and 7.4% of all hospital bed days (Table). On average, each affected individual had 8.3 medical encounters during the year.
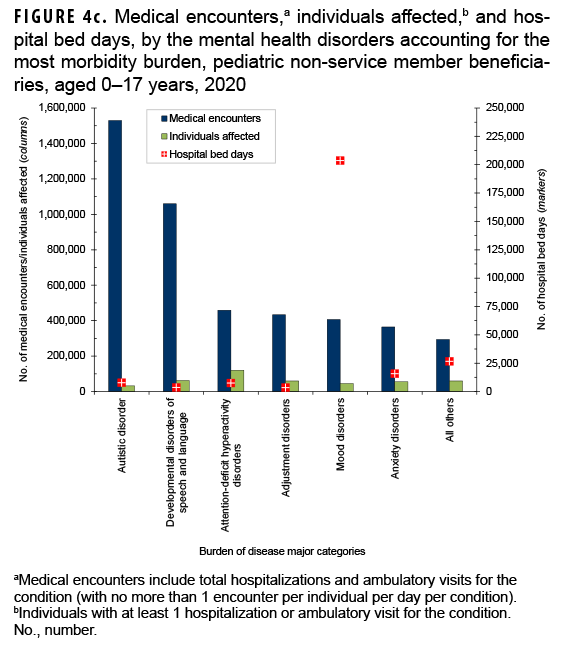
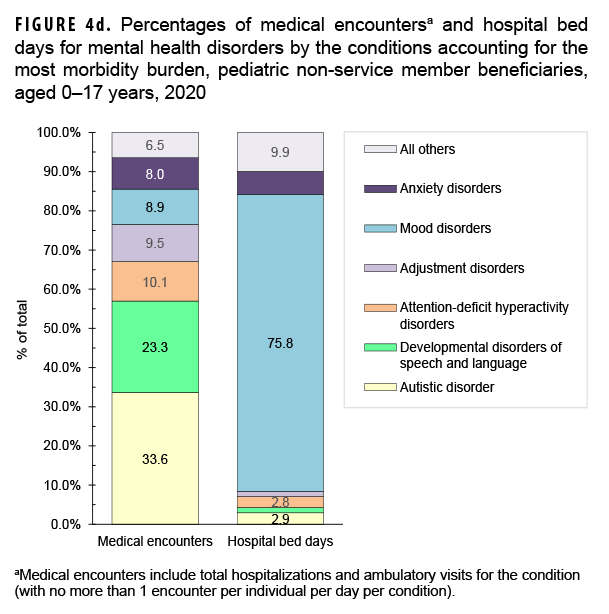
Mental health disorders accounted for slightly more than two-fifths (40.5%; n=4,546,586) of all medical encounters and 59.9% of all hospital bed days (n=268,522) among pediatric beneficiaries (Figures 4a, 4b). On average, each pediatric beneficiary who was affected by a mental health disorder had 15.8 mental health disorder-related encounters during the year. More than two-thirds (67.1%) of all medical encounters for mental health disorders among pediatric beneficiaries were for autistic disorder (33.6%), followed by developmental disorders of speech and language (23.3%), and attention deficit disorders (10.1%) (Figures 4c, 4d). On average, there were 47.9 autism-related encounters per individual affected with autistic disorder and 16.9 encounters for developmental disorders of speech and language per individual affected with those specific disorders (data not shown). Despite the high numbers of encounters associated with these 3 categories of mental health disorders, slightly more than three-quarters (75.8%) of mental health disorder-related hospital bed days were attributable to mood disorders, and 28.2% of mood disorder-related bed days were attributable to "disruptive mood dysregulation disorder" (data not shown).
Among pediatric beneficiaries overall, "conditions arising during the perinatal period" (i.e., perinatal conditions) accounted for the second most hospital bed days (n=43,821; 9.8%) (Figures 4a, 4b). Of note, among pediatric beneficiaries with at least 1 illness- or injury-related diagnosis, those with malignant neoplasms had the second highest number of related encounters per affected individual (14.0). The highest numbers of malignant neoplasm-related encounters were attributable to leukemias, "all other malignant neoplasms," and brain neoplasms, while the highest numbers of bed days were attributable to leukemias, brain neoplasms, and "all other malignant neoplasms" (data not shown).
Finally, respiratory infections (including upper and lower respiratory infections and otitis media) accounted for relatively more medical encounters among pediatric beneficiaries (7.2% and 2.2%, respectively) when compared to any older age group of beneficiaries (Figures 4b, 5b, 6b, and 7b).
Beneficiaries aged 18–44 years
In 2020, non-service member beneficiaries aged 18–44 years accounted for 15.1% of all medical encounters, 22.5% of all individuals affected, and 11.3% of hospital bed days (Table). On average, each individual affected with an illness or injury (any cause) had 8.7 medical encounters during the year.
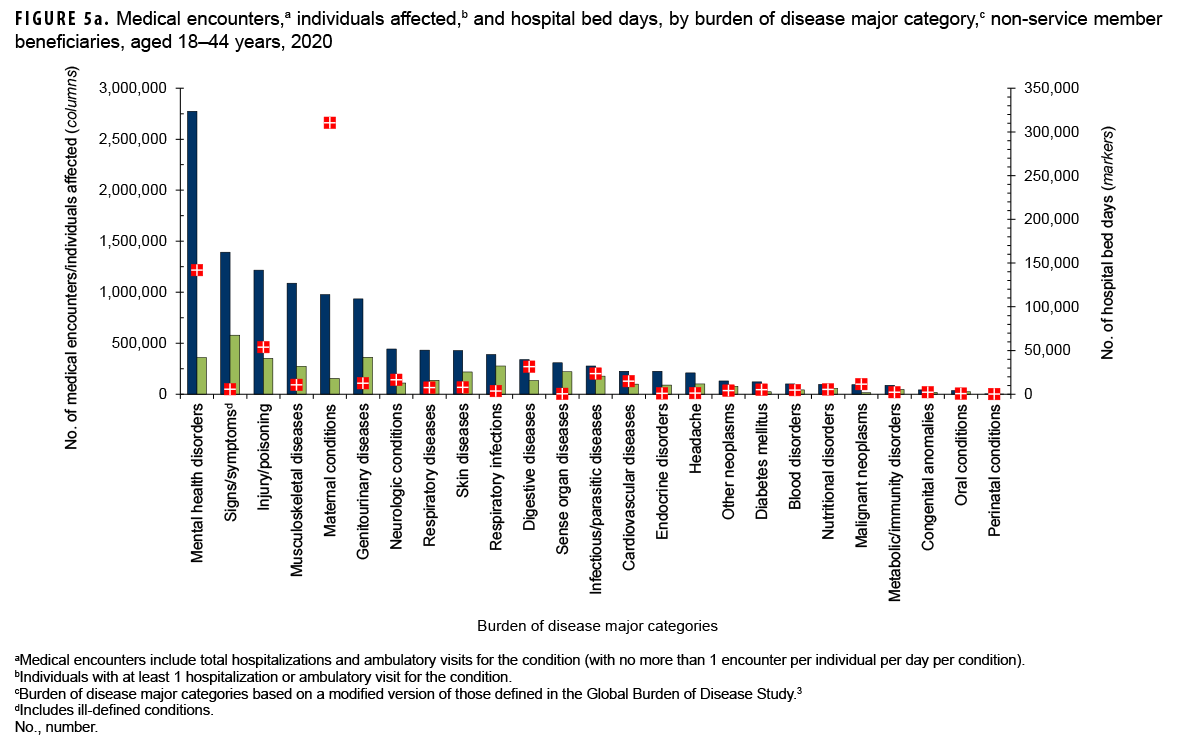
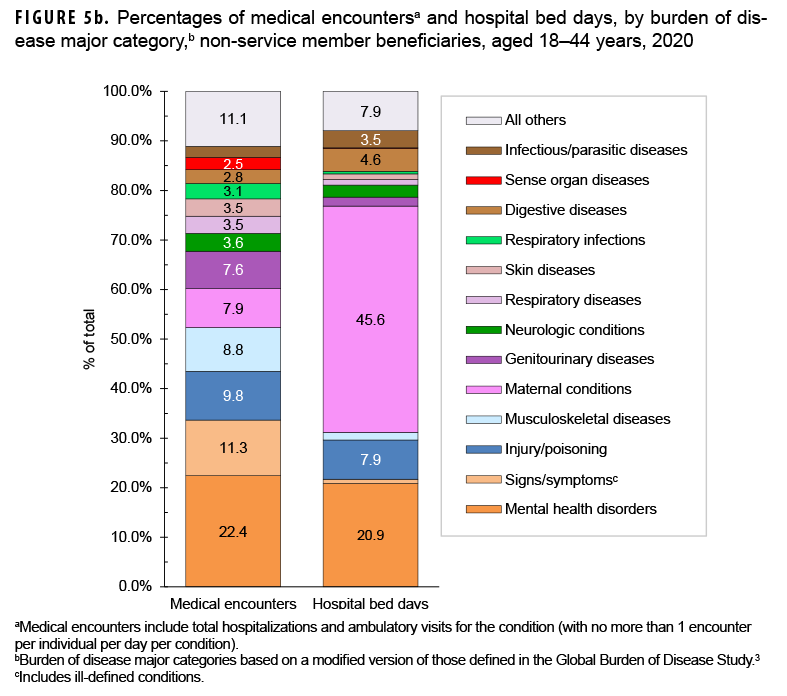
Among beneficiaries aged 18–44 years, the morbidity-related category that accounted for the most medical encounters was mental health disorders (n=2,774,051; 22.4% of all encounters) (Figures 5a, 5b). Among these adult beneficiaries, mental health disorders accounted for slightly more than a quarter (25.5%) of all bed days, and, on average, each adult affected by a mental health disorder had 7.7 mental health disorder-related encounters during the year. Mood disorders (30.9%), anxiety disorders (31.5%), and adjustment disorders (17.7%) accounted for approximately four-fifths (80.1%) of all mental health disorder-related medical encounters among beneficiaries aged 18–44 years (data not shown).
Among adults aged 18–44 years, maternal conditions accounted for more than two-fifths (45.6%) of all bed days and, on average, 6.3 medical encounters per affected individual (Figures 5a, 5b). Normal deliveries accounted for 10.4% of maternal condition-related medical encounters (data not shown). Adults aged 18–44 years accounted for nearly all (99.4%) maternal condition-related bed days among beneficiaries not in military service. Although adults aged 18–44 years had the second lowest percentage of total medical encounters (15.1%), if morbidity burdens associated with maternal conditions were excluded from the overall analysis, this age group would account for even lower percentages of total medical encounters (13.9%) and the lowest percentage of total hospital bed days (6.1%) when compared to any other age group (data not shown).
Among beneficiaries aged 18–44 years with at least 1 illness or injury-related diagnosis, those with malignant neoplasms had the second most (along with maternal conditions) category-specific encounters per affected individual (6.5). Of all malignant neoplasms, breast cancer accounted for the most malignant neoplasm-related encounters (28.9% of the total) (data not shown).
Beneficiaries aged 45–64 years
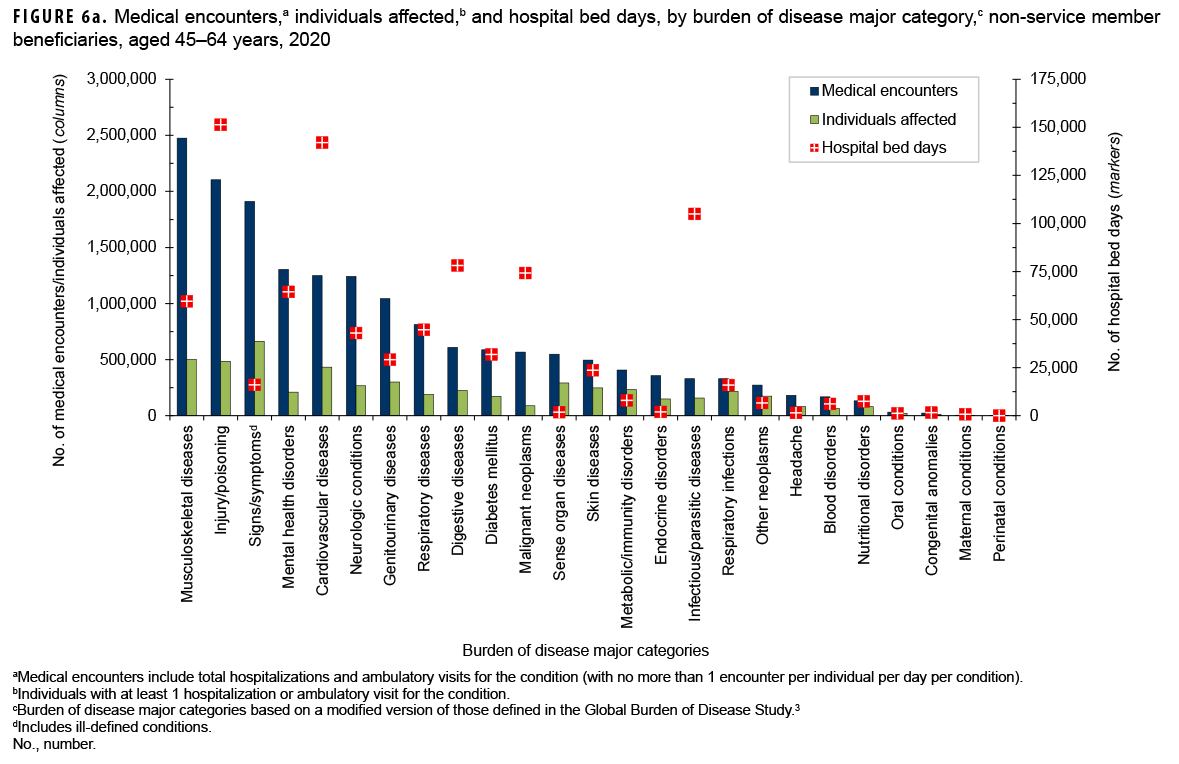
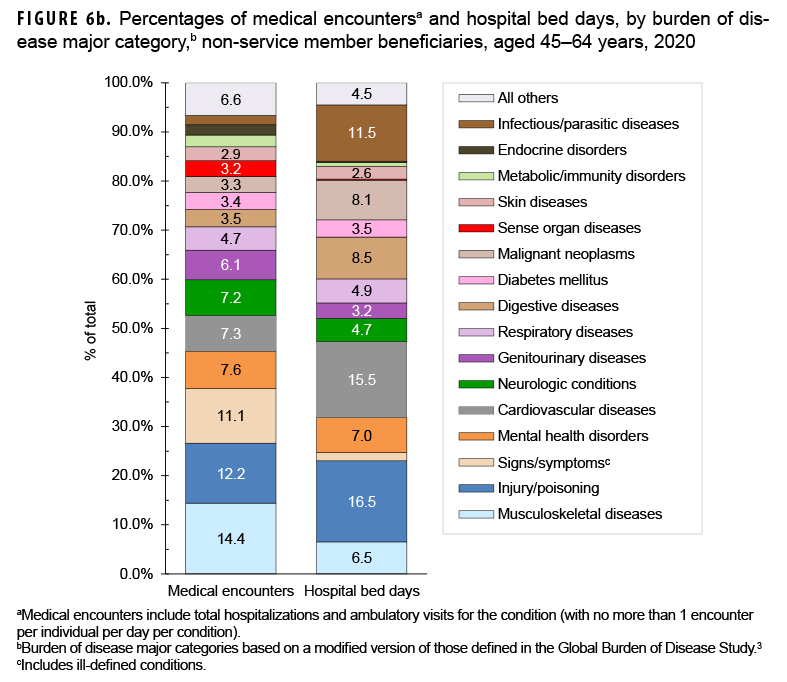
In 2020, non-service member beneficiaries aged 45–64 years accounted for 20.9% of all medical encounters, 23.0% of all individuals affected, and 15.2% of hospital bed days (Table). On average, each affected individual had 11.9 medical encounters during the year.
Of all morbidity-related categories, musculoskeletal diseases accounted for the most medical encounters (n=2,476,302; 14.4%) among older adult beneficiaries (Figures 6a, 6b). In addition, in this age group, back problems accounted for 43.9% of all musculoskeletal disease-related encounters (data not shown). Injury/poisoning accounted for more hospital bed days (16.5% of the total) than any other category of illnesses or injuries, and other complications not otherwise specified (NOS) and leg injuries accounted for 44.5% and 18.9%, respectively, of all injury/poisoning-related bed days (data not shown). Digestive diseases accounted for a larger percentage (8.5%) of total hospital bed days among beneficiaries in this age group compared to those in the other age groups.
The most medical encounters per affected individual were associated with malignant neoplasms (6.5), mental health disorders (6.2), musculoskeletal diseases (4.9), neurologic conditions (4.6), injury/ poisoning (4.3), respiratory diseases (4.3), and maternal conditions (4.2) (Figures 6a, 6b). Malignant neoplasms (8.1%) accounted for a larger proportion of total bed days among beneficiaries aged 45–64 years than among the other age groups of beneficiaries. Breast cancer accounted for nearly one quarter (24.1 %) of all malignant neoplasm-related encounters among older adult beneficiaries (data not shown).
Beneficiaries aged 65 years or older
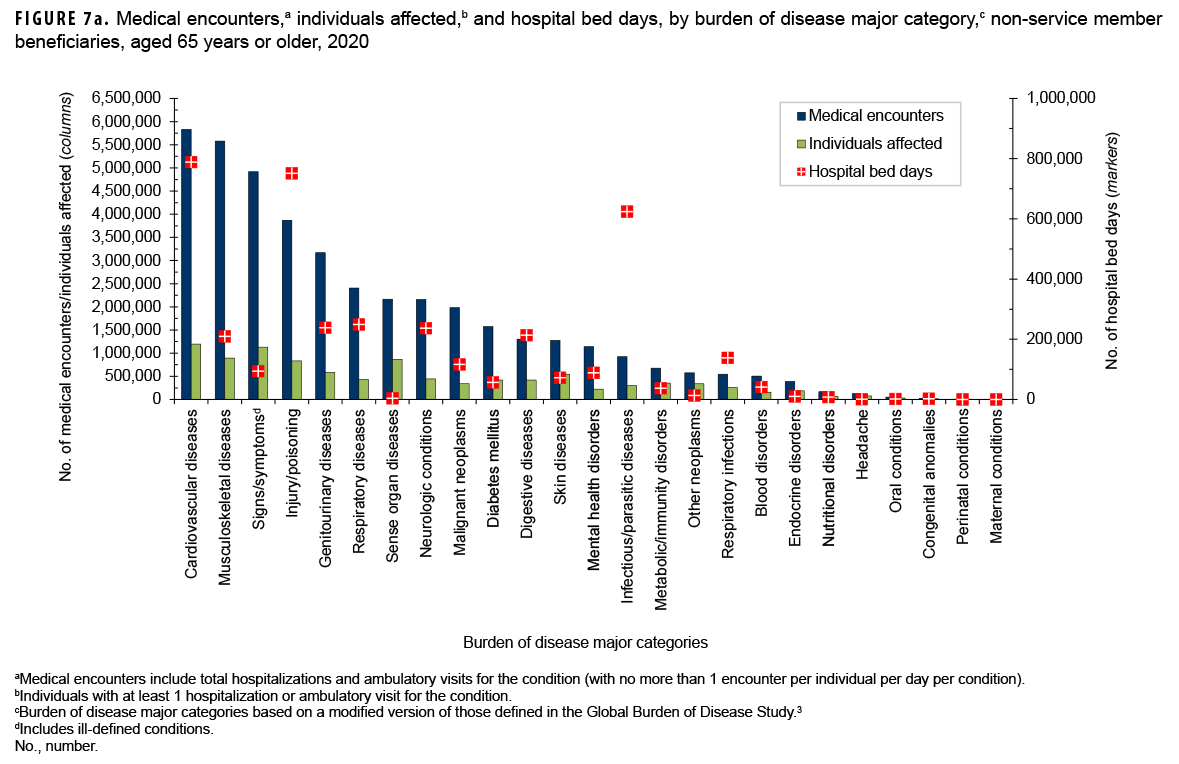
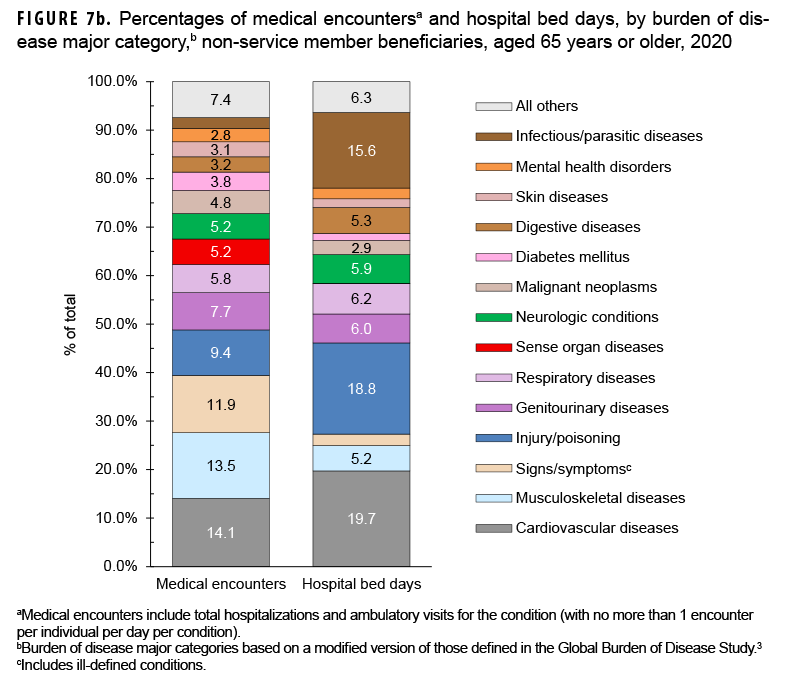
In 2020, non-service member beneficiaries aged 65 years or older accounted for approximately half (50.3%) of all medical encounters, nearly one-third (33.0%) of all individuals affected, and approximately two-thirds (66.2%) of hospital bed days (Table 1). On average, each affected individual had 20.0 medical encounters during the year.
Of all morbidity-related categories, musculoskeletal diseases (n=5,832,066; 14.1%) and cardiovascular diseases (n=5,579,928; 13.5%) accounted for the most medical encounters, but cardiovascular diseases accounted for the most bed days (788,950 days; 19.7%) Figures 7a, 7b). Back problems accounted for a little more than one-third (35.8%) of all musculoskeletal disease-related medical encounters and 37.0% of hospital bed days (data not shown). Taken together, essential hypertension (26.8%), ischemic heart disease (13.7%), and cerebrovascular disease (10.0%) accounted for slightly more than half (50.5%) of all cardiovascular disease-related medical encounters, and cerebrovascular disease accounted for over one-third (33.7%) of all cardiovascular disease-related bed days (data not shown).
Among the oldest age group of beneficiaries, the most medical encounters per affected individual were associated with musculoskeletal diseases (6.3), malignant neoplasms (5.8), respiratory diseases (5.8), respiratory diseases (5.6), diseases of the genitourinary system (5.4), mental health disorders (5.1), and cardiovascular diseases (4.9) (Figure 7a). In this age group, melanomas and other skin cancers (19.6%); prostate cancer (14.5%); breast cancer (12.3%); and trachea, bronchus, and lung cancers (10.1%) accounted for more than half (56.5%) of all malignant neoplasm-related encounters (data not shown). Chronic obstructive pulmonary disease accounted for nearly one-third of all medical encounters (32.4%) and 21.4% of all bed days attributable to respiratory diseases (data not shown).
Infectious and parasitic diseases (15.6%) accounted for a larger proportion of total bed days among the oldest age group compared to the other age groups of beneficiaries (Figures 7a, 7b). Coronavirus disease 2019 (COVID-19) accounted for more than one-quarter (27.4%) of infectious/parasitic-related medical encounters and 44.9% of hospital bed days (data not shown). In contrast to infectious/parasitic diseases, mental health disorders accounted for smaller percentages of medical encounters (2.8%) and bed days (2.2%) among the oldest age group compared to the younger age groups.
Editorial Comment
This report documents that a large majority of the health care services for current illness and injury (excluding encounters with diagnoses identified by Z-codes) that are provided through the MHS to non-service member beneficiaries are delivered in non-military medical facilities (i.e., outsourced [purchased] care). The report also documents that there are pronounced differences in the types of morbidity and the natures of the care provided for evaluation and treatment across age groups of beneficiaries. Of particular note, individuals aged 65 years or older—33.0% of all non-service member beneficiaries—accounted for approximately half (50.3%) of all medical encounters and two-thirds (66.2%) of all hospital bed days delivered to all such beneficiaries.
In 2020, as in previous years, mental health disorders accounted for the largest proportions of the morbidity and health care burdens that affected the pediatric (aged 0–17 years) and younger adult (aged 18–44 years) beneficiary age groups. Developmental disorders were a significant driver of health care utilization among pediatric beneficiaries with 67.1% of medical encounters for mental health disorders attributable to autistic disorder, developmental speech/language disorders, or attention-deficit hyperactivity disorders. Of particular note, children affected by autistic disorder had, on average, 47.9 autism-related encounters each during the 1-year surveillance period.
Although mental health disorders also accounted for more medical encounters among young adult (18–44 years) beneficiaries than any other major category of illnesses or injuries, the proportion of all encounters attributable to mental health disorders was markedly lower among young adult (22.4%) than pediatric (40.5%) beneficiaries. Also, as expected, the mental health disorders that accounted for the largest health care burdens among younger adults (18–44 years)—mood, anxiety, and adjustment disorders—differed from those that most affected the pediatric age group.
It is not surprising that the highest numbers and proportions of hospital bed days among adults aged 18–44 years were for maternal conditions because this age group encompasses nearly all women of childbearing age. Among older adults (aged 45–64 years), musculoskeletal diseases were the greatest contributors to morbidity and health care burdens, and among adults aged 65 years or older, cardiovascular diseases accounted for the most morbidity and health care burdens.
Of musculoskeletal diseases, back problems were a major source of health care burden; of cardiovascular diseases, essential hypertension, ischemic heart disease, and cerebrovascular disease accounted for the largest health care burdens. These findings are not unexpected and reflect the inevitable effects of aging on the health and health care needs of the older segment of the MHS beneficiary population. However, many of the health conditions associated with the largest morbidity and health care burdens among beneficiaries in older age groups are also associated with unhealthy lifestyles (e.g., unhealthy diet, inadequate exercise, or tobacco use). As such, to varying extents, the most costly health conditions may be preventable and their disabling or life-threatening long-term consequences may be avoidable. It is important to note, however, that among the oldest group of beneficiaries, COVID-19 accounted for more than two-fifths (44.9%) of hospital bed days attributed to infectious/parasitic diseases. Illnesses and injuries that disproportionately contribute to morbidity and health care burdens in various age groups of MHS beneficiaries should be targeted for early detection and treatment by comprehensive prevention and research programs.
References
- Department of Defense. Evaluation of the TRICARE Program: Fiscal Year 2020 Report to Congress: Access, Cost, and Quality Data Through Fiscal Year 2019. Accessed 6 May 2021. https://www. health.mil/Reference-Center/Reports/2020/06/29/ Evaluation-of-the-TRICARE-Program-Fiscal-Year2020-Report-to-Congress
- Armed Forces Health Surveillance Center. Absolute and relative morbidity burdens attributable to various illnesses and injuries, non-service member beneficiaries of the Military Health System, 2013. MSMR. 2014;21(4):23–30.
- Murray CJ and Lopez AD, eds. In: Global Burden of Disease: A Comprehensive Assessment of Mortality and Disability from Diseases, Injuries, and Risk Factors in 1990 and Projected to 2020. Cambridge, MA: Harvard University Press; 1996:120–122.