What Are the New Findings?
In 2020, the overall numbers and rates of active component service member ambulatory care visits decreased slightly compared to previous years. Most categories of illness and injury showed modest declines in numbers and rates. The proportions of ambulatory care visits that were accomplished via telehealth encounters increased to 19% in 2020, compared to 14% in 2016 and 2018.
What Is the Impact on Readiness and Force Health Protection?
The response to the coronavirus pandemic may have been associated with not only a decrease in the incidence of disease and injury diagnoses in the service member population but also an increase in the proportions of health care encounters delivered through telehealth. Lessons learned may guide future steps in reducing disease and injury incidence in the post-pandemic era.
Background
This report documents the frequencies, rates, trends, and characteristics of ambulatory health care visits of active component members of the U.S. Army, Navy, Air Force, and Marine Corps during 2020. Ambulatory visits of U.S. service members in fixed military and nonmilitary (reimbursed through the Military Health System [MHS]) medical treatment facilities are documented with standardized, automated records. These records are routinely archived for health surveillance purposes in the Defense Medical Surveillance System (DMSS), which is the source of data for this report. Ambulatory visits that are not routinely and completely documented with standardized electronic records (e.g., during deployments, field training exercises, or at sea) are not included in this analysis.
As in previous MSMR reports, all records of ambulatory visits of active component service members were categorized according to the first 4 characters of the International Classification of Diseases, 10th Revision (ICD-10) codes entered in the primary (first-listed) diagnostic position of the visit records.1In this analysis, a special query of the DMSS records was performed to distinguish ambulatory visits that were accomplished via "telehealth" encounters (e.g., via telephone or video teleconference) rather than in-person encounters. Both types of encounters were included and not distinguished in most of the data summaries, but trends in the proportions of encounters that were accomplished via telehealth were examined because of the increased use of telehealth encounters during the coronavirus 2019 (COVID-19) pandemic.
Frequencies, rates, and trends
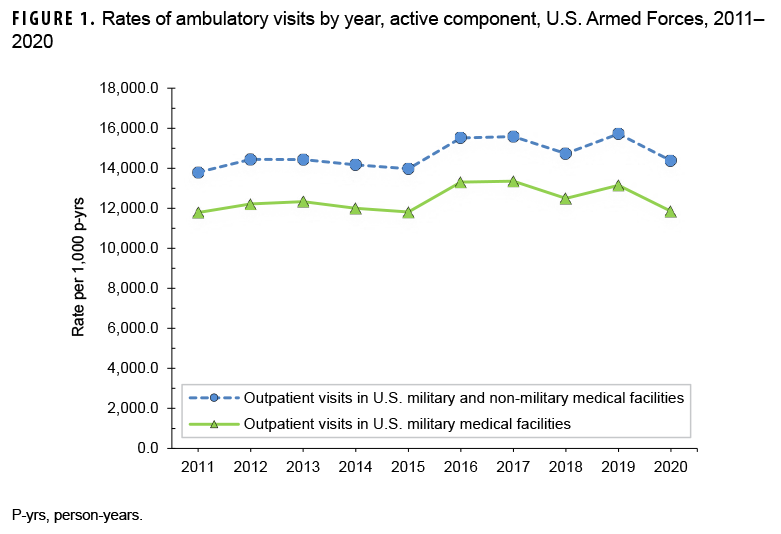
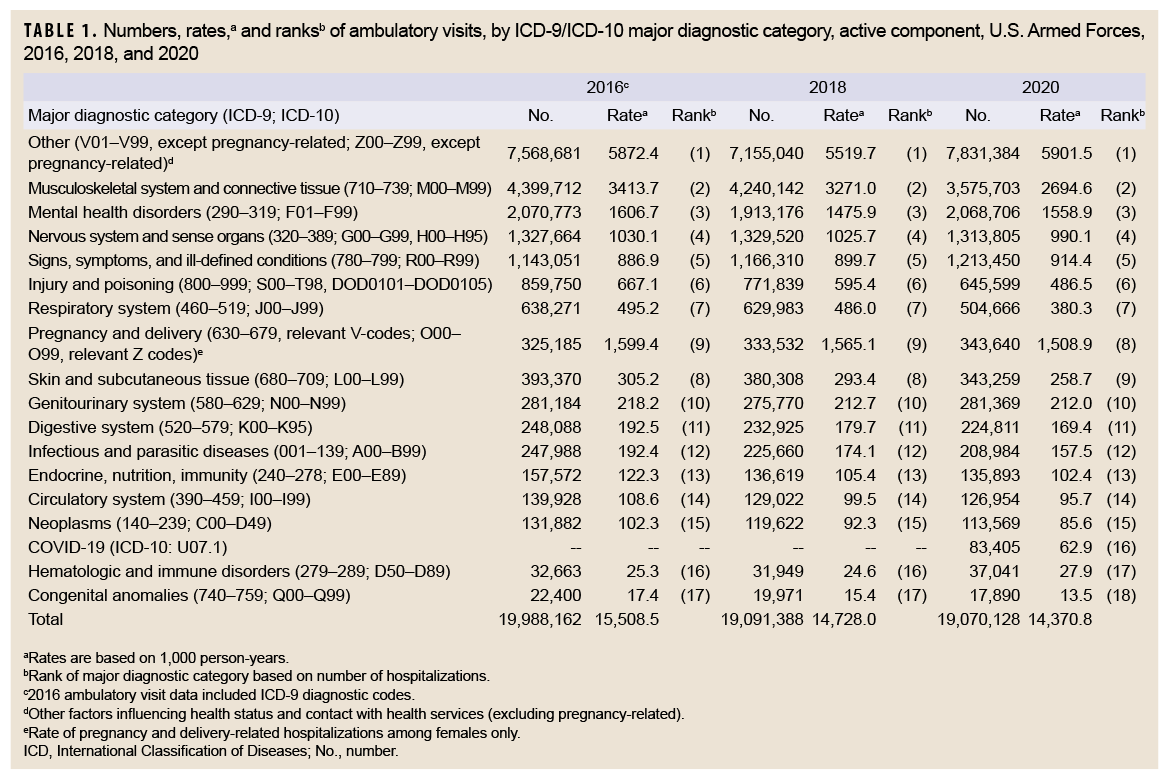
During 2020, there were 19,070,128 reported ambulatory visits of active component service members. "Visits'' refers to encounters accomplished via in-person clinical meetings as well as "telehealth" encounters. The crude annual rate (all causes) was 14,370.8 visits per 1,000 person-years (p-yrs) or 14.4 visits per p-yr; thus, on average, each service member had approximately 14 ambulatory encounters during the year (Table 1). The rate of documented ambulatory visits in 2020 was 4.2% higher than the lowest point in 2011 (13,792.8 per 1,000 p-yrs) and 8.6% lower than the peak in 2019 (15,718.5 visits per 1,000 p-yrs) (Figure 1). In 2020, 41.1% of ambulatory visits were classified into the "other" category (i.e., other factors influencing health status and contact with health services, excluding pregnancy-related), which includes health care not related to a current illness or injury (Table 1). Such care includes routine and special medical examinations (e.g., periodic, occupational, or retirement), therapeutic and rehabilitative treatments for previously diagnosed illnesses or injuries (e.g., physical therapy), immunizations, counseling, deployment-related health assessments, and screening.
In 2020, there were 11,238,744 documented ambulatory visits for illnesses and injuries (ICD-10: A00–T88, including relevant pregnancy Z-codes), not including diagnoses classified as "other" for a crude annual rate of illness- and injury-related visits of approximately 8.5 visits per p-yr (Table 1). The crude annual rate of ambulatory visits for illnesses and injuries in 2020 was slightly lower than the rates in 2018 (9.2 visits per p-yr) and 2016 (9.6 visits per p-yr).
Ambulatory visits, by diagnostic categories
In 2020, 4 major diagnostic categories accounted for almost three-quarters (72.7%) of all illness- and injury-related ambulatory visits among active component service members: musculoskeletal system/connective tissue disorders (31.8%); mental health disorders (18.4%); disorders of the nervous system and sense organs (11.7%); and signs, symptoms, and ill-defined conditions (10.8%) (Table 1). COVID-19 accounted for 0.44% of the total ambulatory visits in 2020.
Between 2016 and 2020, there were increases in the numbers of visits in 4 major diagnostic categories of illness and injury and decreases in 12 categories (Table 1). In terms of both the numbers of ambulatory visits and the percentage change in the numbers of visits for illnesses and injuries, the largest increases during 2016–2020 were for signs, symptoms, and ill-defined conditions (change: +70,399 visits; +6.2%) and pregnancy and delivery (change: +18,455; +5.7%). The largest decrease in numbers of visits between 2016 and 2020 was for musculoskeletal system/connective tissue disorders (change: -824,009; -18.7%) (Table 1). The largest percentage decreases in ambulatory visits during 2016–2020 were for injury and poisoning (change: -214,151; -24.9%); respiratory system disorders (change: -133,605; -20.9%); congenital anomalies (change: -4,510; -20.1%); infectious and parasitic diseases (change: -39,004; -15.7%); neoplasms (change: -18,313; -13.9%); endocrine, nutrition, and immunity disorders (change: -21,679; -13.8%); and disorders of skin and subcutaneous tissue (change: -50,011; -12.7%); moreover, the rates of ambulatory visits for illnesses and injuries in all of these categories showed consistent decreases during the 5-year period (2016–2018 and 2018–2020).
In general, the relative distributions of ambulatory visits by ICD-10 diagnostic categories remained stable over the surveillance period (Table 1). In a comparison of the numbers and rates of visits attributable to each of the 17 major diagnostic categories in the 3 years of interest, the rank orders of 1 pair of categories were exchanged in 2016 and 2018 relative to 2020: pregnancy and delivery (9th to 8th) and disorders of skin and subcutaneous tissue (8th to 9th). COVID-19 was included as a separate diagnostic category in 2020 and ranked 16th in total visits.
Ambulatory visits, by sex
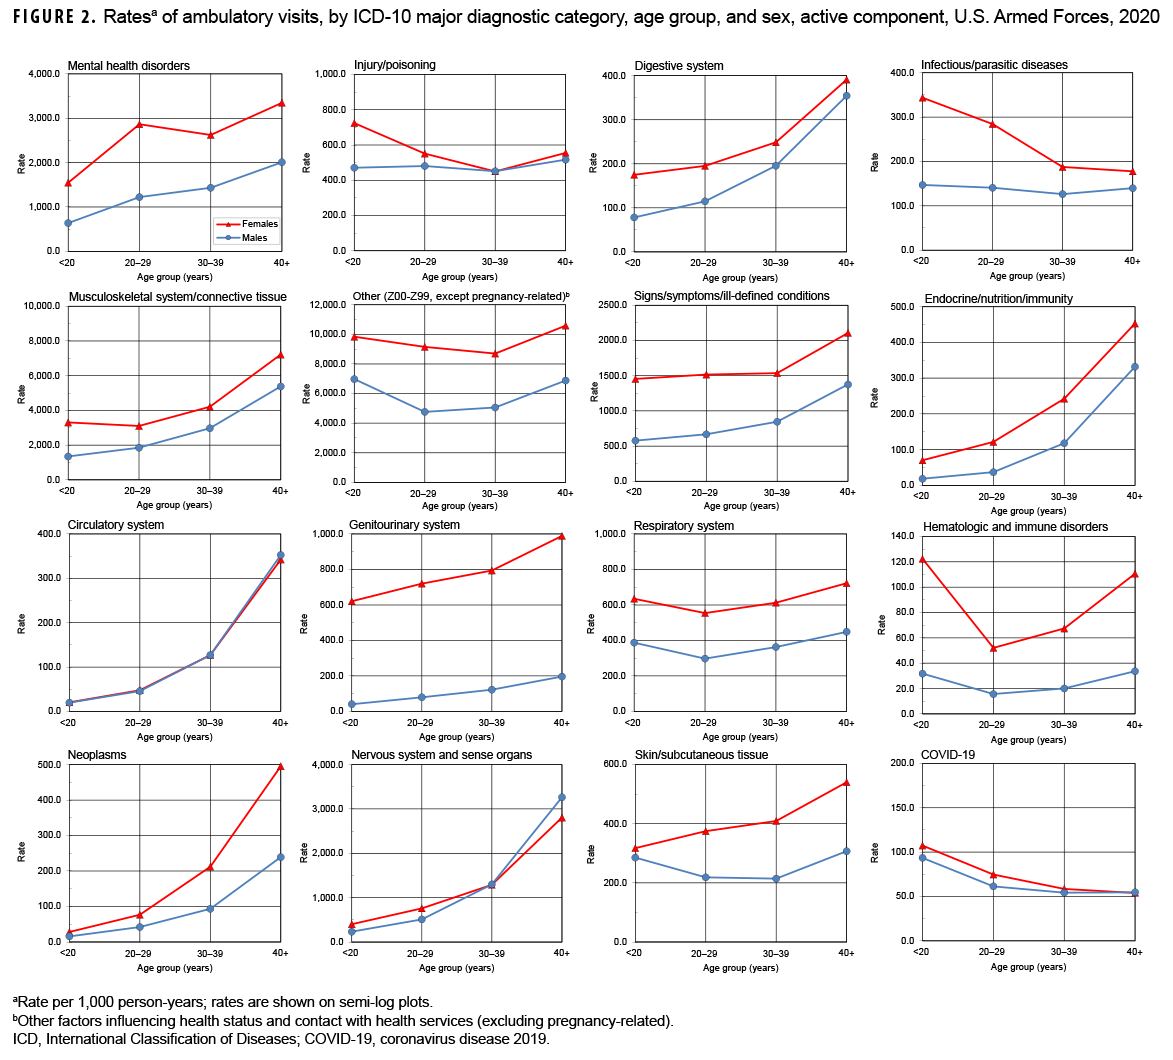
In 2020, males accounted for nearly three-fourths (71.9%) of all illness- and injury-related visits; however, the annual crude rate among females (13.9 visits per p-yr) was 88.6% higher than that among males (7.4 visits per p-yr) (data not shown). Excluding pregnancy- and delivery-related visits (which accounted for 10.9% of all non-Z-coded ambulatory visits among females), the illness and injury ambulatory visit rate among females was 12.4 visits per p-yr. As in the past, rates for illness- and injury-related categories were generally higher among females than males (Figure 2).
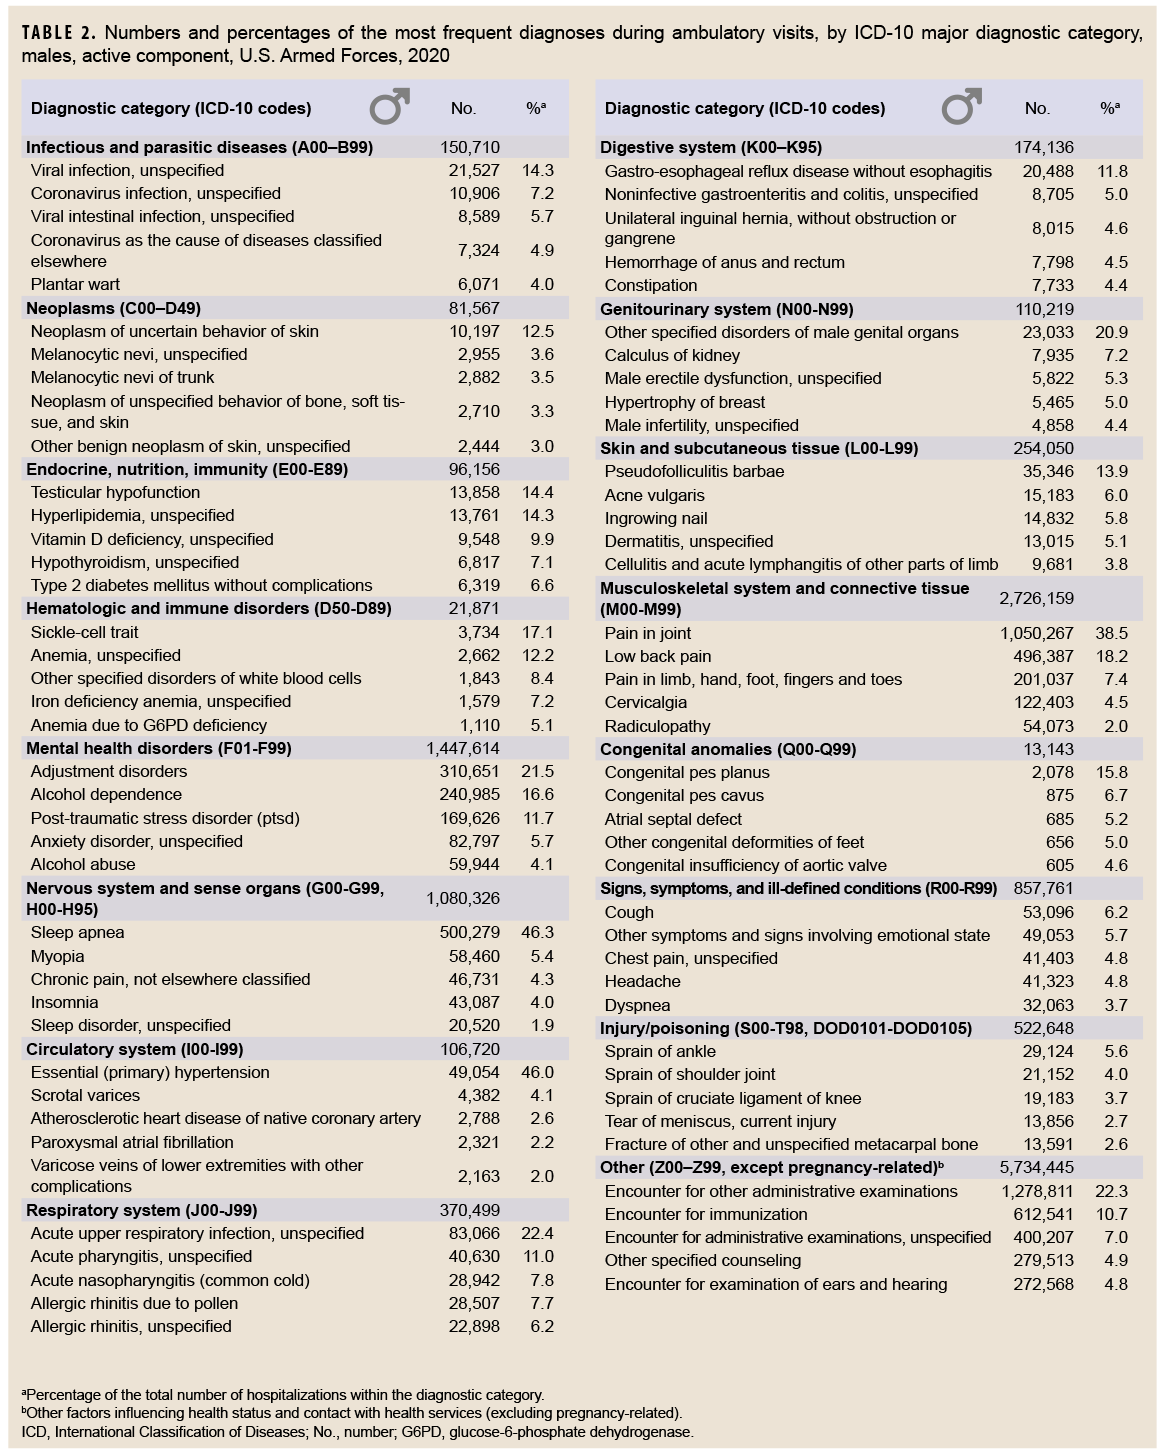
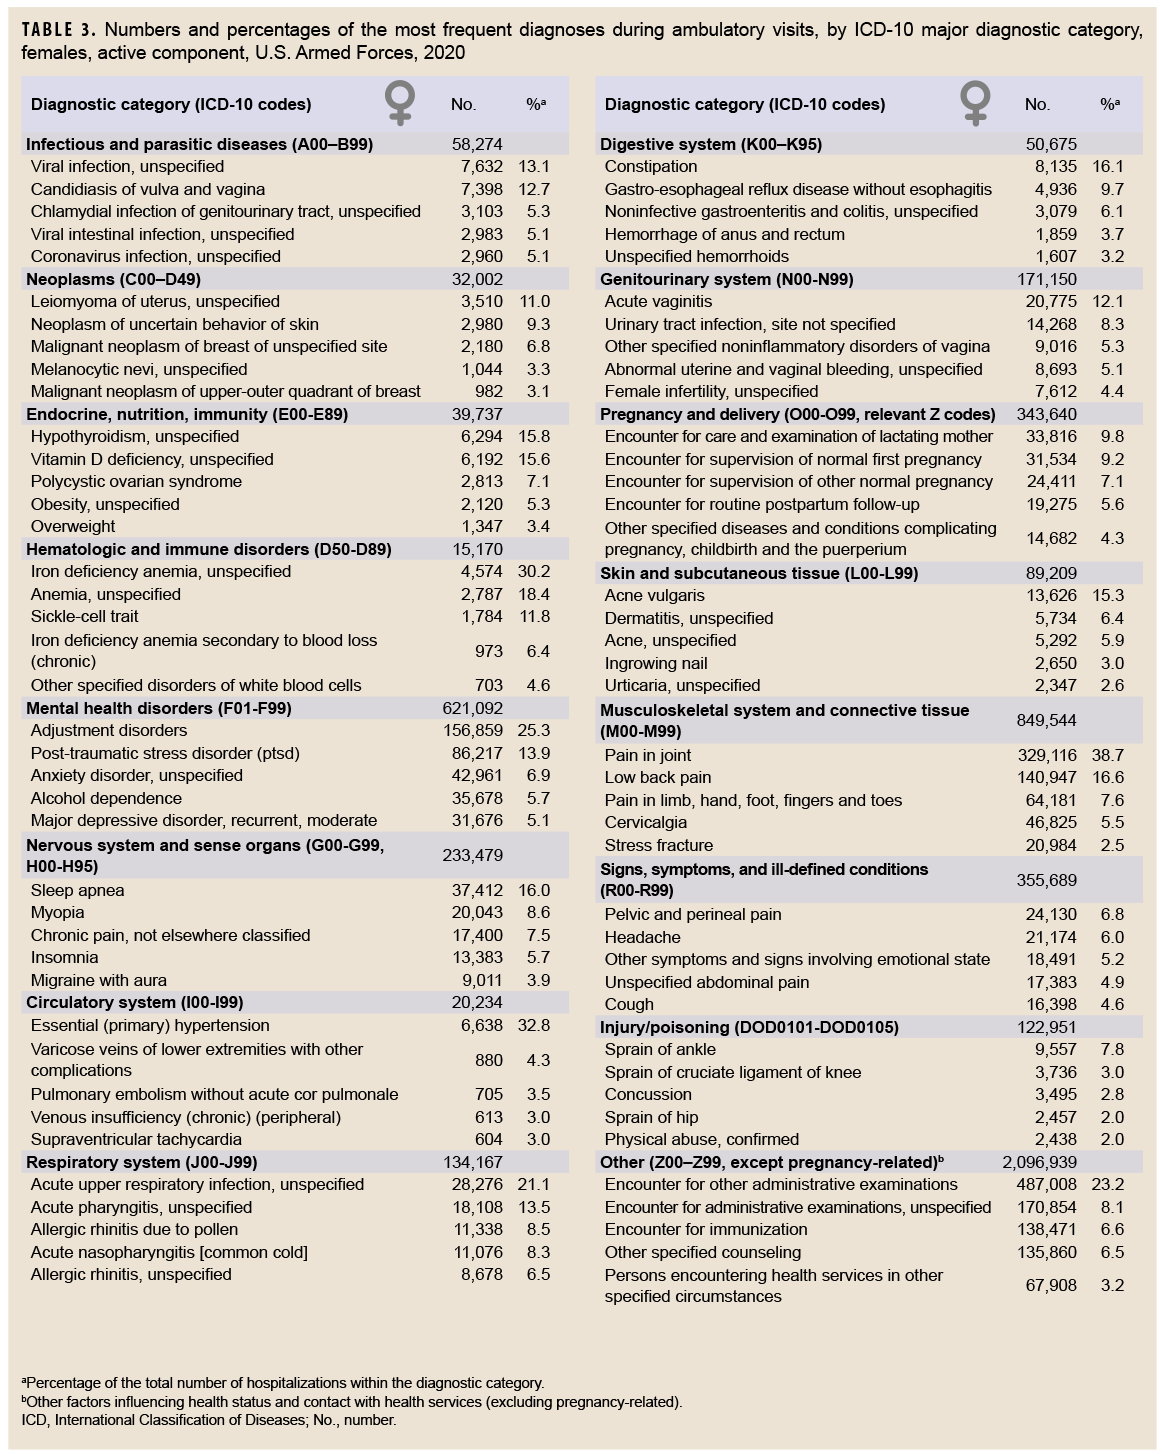
Among all illness- and injury-specific diagnoses, 3 of the 5 diagnoses with the largest numbers of ambulatory visits were the same for males and females. However, the crude rate (per 1,000 p-yrs) was at least 37% higher among females than males for these 3 common diagnoses: pain in joint (female: 1,445.2; male: 955.4; female:male rate ratio [RR]: 1.51); low back pain (female: 618.9; male: 451.6; RR: 1.37); and adjustment disorders (female: 688.8; male: 282.6; RR: 2.44) (data not shown). Five other diagnoses were among the 10 most common diagnoses for both males and females: pain in limb, hand, foot, fingers, and toes; post-traumatic stress disorder (PTSD); sleep apnea; alcohol dependence; and cervicalgia. Of note, sleep apnea was the 2nd most frequent illness- or injury-specific primary diagnosis during ambulatory visits of males, but it ranked as the 8th most common diagnosis among females. Among females, the 7th most common diagnosis was anxiety disorder, unspecified, which was the 10th most common diagnosis among males (Tables 2, 3).
Across diagnostic categories, relationships between age group and ambulatory visit rates were broadly similar among males and females(Figure 2). For example, among both males and females, ambulatory visit rates for neoplasms and circulatory disorders among those aged 40 years or older were 15 or more times the rates among those younger than 20 years old; in contrast, clinic visit rates for infectious and parasitic diseases were lower among the oldest compared to the youngest service members. As in the past, ambulatory visit rates for disorders of the nervous system; digestive system; endocrine system, nutrition, and immunity; and musculoskeletal system/connective tissue rose more steeply with advancing age than most other categories of illness or injury (for which rates were relatively stable or only modestly increased) (Figure 2)
Dispositions after ambulatory visits
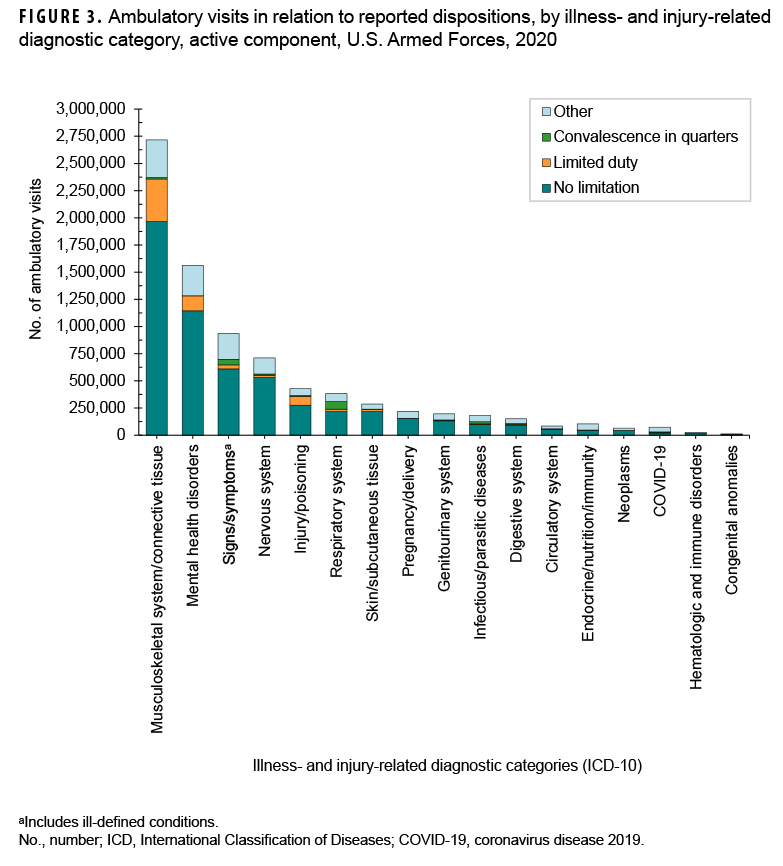
Because disposition codes are assigned to ambulatory medical encounters that occur only at military treatment facilities (MTFs), the following metrics do not include outsourced care. Approximately 69.1% of all illness- and injury-related visits resulted in "no limitation" (i.e., duty without limitations) dispositions (data not shown). Of illness- and injury-related visits, 2.3% resulted in "convalescence in quarters" dispositions (data not shown). The illness- and injury-related diagnostic categories with the highest proportions of "limited duty" dispositions were injuries and poisonings (18.9%) and musculoskeletal system/connective tissue disorders (14.4%)& (Figure 3). The illness- and injury-related diagnostic categories with the highest proportions of "convalescence in quarters" were infectious and parasitic diseases (9.9%) and diseases of the respiratory system (18.3%). Musculoskeletal system/connective tissue disorders (52.7%) accounted for more than one-half of all "limited duty" dispositions, and mental health disorders (18.5%) and injury/poisoning (10.9%) together accounted for more than one-quarter (29.4%) (Figure 4). Diseases of the respiratory system accounted for nearly three-eighths (36.8%) of all "convalescence in quarters" dispositions—more than twice as many (n=70,184) as any other disease category, except signs and symptoms (26.5%).
Ambulatory visits accomplished via telehealth
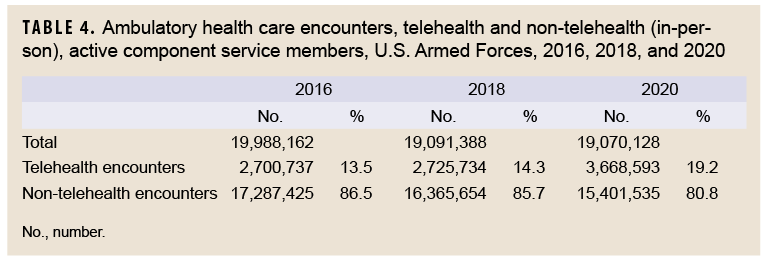
During the years 2016, 2018, and 2020, the total numbers of ambulatory encounters (telehealth and in-person) were 19,988,162; 19,091,388; and 19,070,128, respectively (Table 4). The percentages of encounters that were telehealth approximated 14% in the first 2 of those years, but rose to 19.2% in 2020. While the number of telehealth encounters increased by 942,859 encounters from 2018 to 2020, the number of non-telehealth encounters fell by 964,119 during that interval. Among the 17 different major diagnostic categories, the number of telehealth encounters in 2020 surpassed the numbers for both 2018 and 2016 for 15 of the categories. The only exceptions were for the 2 categories endocrine, nutrition, and immunity and injury and poisoning (data not shown).
Editorial Comment
During the 5-year period covered by the years 2016, 2018, and 2020, the distribution of illness- and injury-related ambulatory visits in relation to their reported primary causes remained fairly stable. In 2020, musculoskeletal system/connective tissue and mental health disorders accounted for more than one-half (50.2%) of all illness- and injury-related diagnoses documented on standardized records of ambulatory encounters. Over the course of the surveillance period (2016–2018 and 2018–2020), 4 major illness- and injury-related categories (signs/symptoms and ill-defined conditions; pregnancy-related diagnoses; disorders of the genitourinary system; and hematologic and immune disorders) showed modest increases in numbers of ambulatory visits and rates; all other major illness- and injury-related categories showed consistent decreases.
One factor that may partially explain the observed decreases in ambulatory encounters in 2020 is the COVID-19 pandemic which directly affected the health of many service members who acquired coronavirus infections. Indirect effects of the pandemic could be attributed to the implementation of preventive measures taken to lessen transmission of the virus. Such measures included restrictions on housing, training, and social gatherings, all of which may have reduced the incidence of injuries and illnesses in the service member population. The reduced incidence would be reflected in the counts of ambulatory visits in the MHS. In addition, during 2020, medical facilities were encouraged to increase the use of telehealth procedures in order to reduce the risks of virus transmission in the health care settings. These telehealth initiatives may have succeeded in reducing the incidence of not only coronavirus infections but also other infectious diseases.
During 2016–2020, the relative ranking of injuries and poisonings (rank: 6) as a primary cause of ambulatory visits remained stable. However, the numbers and rates of visits were 16.4% and 18.3% lower, respectively, in 2020 compared to 2018. Nevertheless, the potential military operational impacts of various conditions cannot be assessed by numbers of attributable ambulatory visits alone. For example, in 2020, injuries and poisonings accounted for approximately 1 of every 28 ambulatory visits overall; however, of ambulatory visits occurring at MTFs, 20.7% (slightly more than 1 in 5) had limited duty or "convalescence in quarters" dispositions. Of particular note, in relation to injuries and musculoskeletal conditions, in 2020 as in the past, joint and back injuries and other disorders accounted for large numbers of ambulatory visits; resources should continue to be focused on preventing, treating, and rehabilitating back pain and injuries among active component members.
It should be noted that the summary data using the major diagnostic categories of the ICD-10 system presented in Table 1 deserve as detailed an examination as those presented in Tables 2 and 3. For example, the general category identified as "nervous system" encompasses diseases of the nervous system and the sense organs (eyes and ears). Results presented in Tables 2 and 3 indicate that the more common diagnoses in this category refer to sleep disorders, disorders of refraction and accommodation, and pain disorders. Closer scrutiny reveals that even though the annual counts of visits for this category decreased slightly from 2016 (n=1,327,664) to 2020 (n=1,313,805), the counts of diagnoses of the 2 most common sleep disorders (sleep apnea and insomnia) rose from 466,577 in 2016 to 594,161 in 2020.
Several limitations should be considered when interpreting the findings of this report. For example, ambulatory care that is delivered by unit medics and at deployed medical treatment facilities (such as in Afghanistan or Iraq or at sea) may not be documented on standardized, automated records and thus not archived in the DMSS. In turn, this summary does not reflect the experience of active component military members overall to the extent that the natures and rates of illnesses and injuries may vary between those who are deployed and those who are not deployed.
In addition, this summary is based on primary (first-listed) diagnosis codes reported on ambulatory visit records. As a result, the current summary discounts morbidity related to comorbid and complicating conditions that may have been documented in secondary diagnostic positions of the health care records. Furthermore, the accuracy of reported diagnoses likely varies across conditions, care providers, treatment facilities, and clinical settings. Although some specific diagnoses made during individual encounters may not be definitive, final, or even correct, summaries of the frequencies, natures, and trends of ambulatory encounters among active component members are informative and potentially useful. For example, the relatively large numbers of ambulatory visits for mental health disorders in general and the large numbers of visits for organic sleep disorders among males, reflect patterns of responses by the MHS to the effects of combat- and deployment-related stresses on active component service members.
Also, this report documents all ambulatory health care visits but does not provide estimates of the incidence rates of the diagnoses described. In contrast to common, self-limited, and minor illnesses and injuries that require very little, if any, follow-up or continuing care, illnesses and injuries that necessitate multiple ambulatory visits for evaluation, treatment, and rehabilitation are overrepresented in this summary of the ambulatory burden of health care. Finally, medical data from sites that were using the new electronic health record for the Military Health System, MHS GENESIS, between July 2017 and October 2019 were not available in the DMSS at the time of the analysis. These sites include Naval Hospital Oak Harbor, Naval Hospital Bremerton, Air Force Medical Services Fairchild, and Madigan Army Medical Center. Therefore, medical encounter data for individuals seeking care at any of these facilities from July 2017 through October 2019 were not included in the current analysis.
References
- Armed Forces Health Surveillance Branch. Ambulatory visits, active component, U.S. Armed Forces, 2016. MSMR. 2017;24(4):16–22.
