What are the new findings?
In 2025, overall hospitalization rates for U.S. active component service members fell to a 10-year low of 49.2 per 1,000 person-years, driven by a pronounced decline in admissions to military hospitals and clinics. While mental health disorders remained the leading cause of hospitalization, this category experienced the largest absolute decline in admissions compared to 2023, whereas pregnancy and delivery saw the greatest absolute increase.
What is the impact on readiness and force health protection?
The persistent health care burden of mental health disorders and physical injuries, with prolonged hospital stays and high admission rates in specific service branches, affects force readiness directly by increasing lost duty time. These findings suggest that force health protection can be optimized through targeted, service-specific interventions designed to address the distinct occupational hazards and demographic differences identified throughout the Joint Force.
Background
This report documents the frequencies, rates, trends, and distributions of hospitalizations among active component service members (ACSMs) of the U.S. Army, Navy, Air Force, Space Force, and Marine Corps during calendar year 2025. Summaries are based on standardized hospitalization records at U.S. military and non-military (reimbursed through the Military Health System) medical facilities worldwide that are routinely maintained in the Defense Medical Surveillance System (DMSS).
In this report, primary (i.e., first-listed) discharge diagnoses are considered indicative of the primary cause of hospitalization. As in prior MSMR reports, summaries are based on the first 3 digits of the International Classification of Diseases, 10th Revision (ICD-10) codes of the primary discharge diagnoses. Hospitalizations not routinely documented by standardized, automated records, e.g., during field training exercises or while shipboard, are not available in a centralized location for health surveillance purposes and are excluded from this report. Incidence rates were calculated per 1,000 person-years (p-yrs). Percent change in incidence was calculated using unrounded rates.
Frequencies, rates and trends
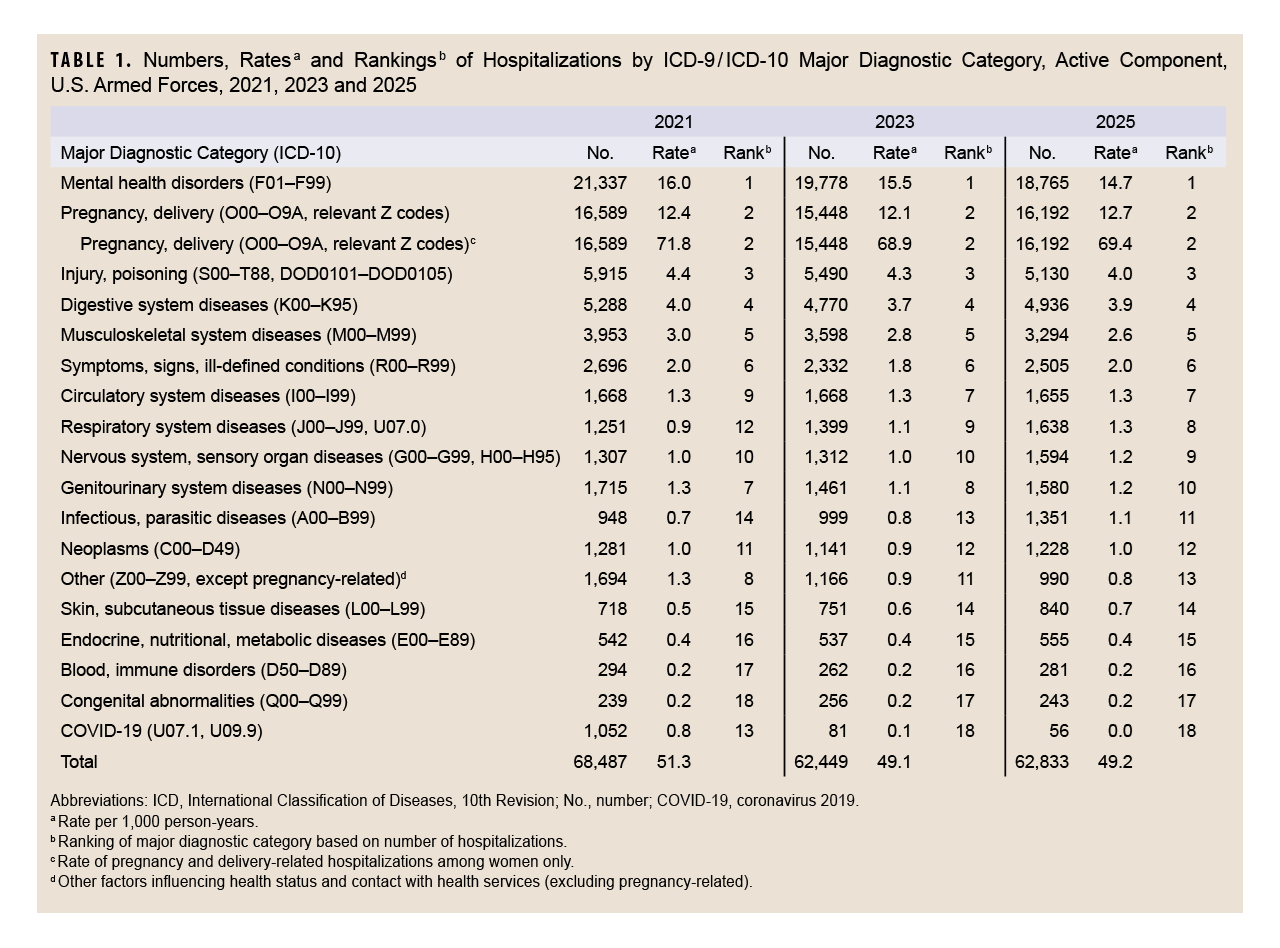
In 2025, 62,833 hospitalizations were recorded for ACSMs of the U.S. Army, Navy, Air Force, Space Force, and Marine Corps (Table 1); of these hospitalizations, 47.3% occurred in non-military facilities (data not shown).
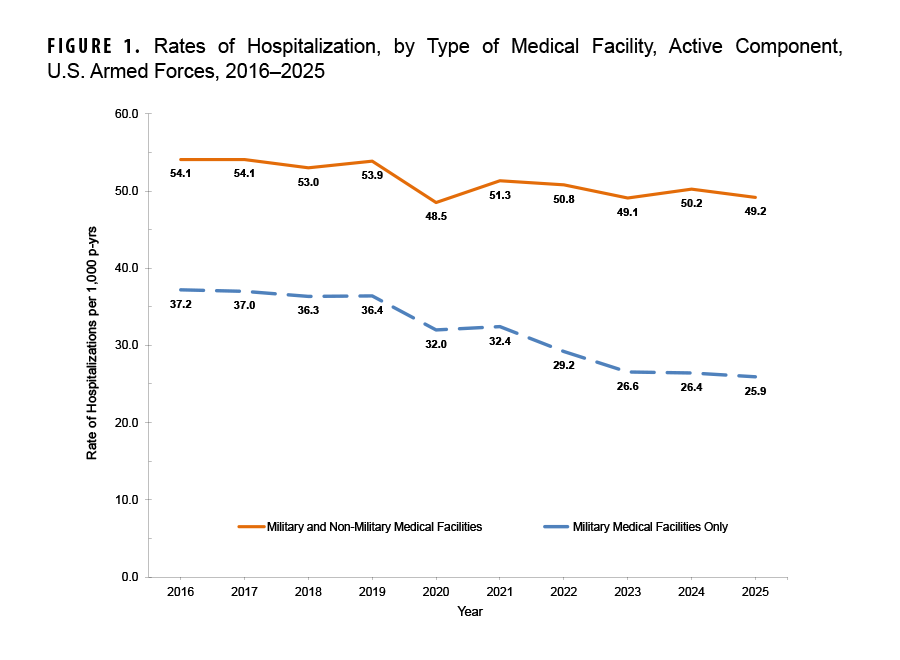 Total crude hospitalization rates declined to a low of 49.2 per 1,000 p-yrs in 2025, from a high of 54.1 per 1,000 p-yrs in 2016 representing a decrease of 9.1% during the 10-year surveillance period. This decline was more pronounced in military hospitals, falling from 37.2 per 1,000 p-yrs in 2016 to 25.9 per 1,000 p-yrs in 2025, representing approximately a 30% reduction over the same period. Between 2016 and 2019 hospitalization rates were relatively stable, fluctuating within a narrow range, but in 2020 rates dropped more than 10%. In 2021, the total hospitalization rate for military and non-military facilities rebounded to 51.3 per 1,000 p-yrs, approaching pre-pandemic levels. Meanwhile, the rates of hospitalization in military facilities remained stable from 2020 to 2021, declining thereafter through 2025 (Figure 1).
Hospitalizations, by ICD-10 major diagnostic categories
In 2025, merely 4 ICD-10 major diagnostic categories accounted for almost three-quarters (71.7%) of all active component hospitalizations: mental health disorders (29.9%), pregnancy and delivery (25.8%), injury and poisoning (8.2%), and digestive system diseases (7.9%) (Table 1). Consistent with findings from 2021 and 2023, hospitalizations for mental health disorders in 2025 accounted for more than any other major diagnostic category.
The largest absolute reduction in hospitalizations occurred in the mental health disorders diagnostic category, with 1,013 fewer hospitalizations in 2025 compared to 2023, constituting a 5.1% decline (Table 1). Several other categories experienced declines during the same period, including injury and poisoning (-360 hospitalizations, -6.6%), musculoskeletal diseases (-304 hospitalizations, -8.4%), ‘other’ factors influencing health status and contact with health services (-176 hospitalizations, -15.1%), and COVID-19-related admissions (-25 hospitalizations, -30.9%).
The pregnancy and delivery diagnostic category represented the largest absolute increase when comparing 2023 to 2025, rising by 744 hospitalizations. The largest relative increases in hospitalizations were observed for infectious and parasitic diseases (+352 hospitalizations, +35.2%), nervous system and sensory organ diseases (+282 hospitalizations, +21.5%), respiratory system diseases (+239 hospitalizations, +17.1%), and skin and subcutaneous tissue diseases (+89 hospitalizations, +11.9%) diagnostic categories.
Hospitalizations, by sex
In 2025, the hospitalization rate—for all causes—among active component service women was more than 3 times that of service men (114.6 per 1,000 p-yrs vs. 34.5 per 1,000 p-yrs, respectively). Excluding pregnancy and delivery, the rate of hospitalizations among women (45.2 per 1,000 p-yrs) was 30.9% higher than among men (34.5 per 1,000 p-yrs) in 2025 (data not shown). This rate difference was primarily due to hospitalizations for mental health disorders (female:male rate difference [RD] 5.8 per 1,000 p-yrs) and genitourinary system diseases (RD 2.2 per 1,000 p-yrs) (data not shown).
Excluding pregnancy and delivery, total hospitalization rates for most major diagnostic categories were comparable between men and women (data not shown), but sex-specific rates varied when stratified by age (Figure 2). Rates among women in all age groups were consistently higher for digestive system diseases, genitourinary system diseases, nervous and sensory organ diseases, endocrine and nutritional diseases, and blood and immune diseases. As in prior years, the sex disparity was greatest for conditions in the genitourinary system category, with women admitted at rates 3–5 times those of men of all age groups. Similarly, hospitalizations rates for neoplasms, congenital abnormalities, and blood and immune diseases were more than twice as high among women compared to men. In contrast, rates among men were higher than those among women in all age groups for conditions in the respiratory system diseases category. Hospitalization rates for mental health disorders were markedly higher for women than men in the younger age groups (<20 and 20-29 years); the gap narrowed significantly with age, and rates became nearly identical for the 30-39-years age group, after which the male rate was slightly higher.
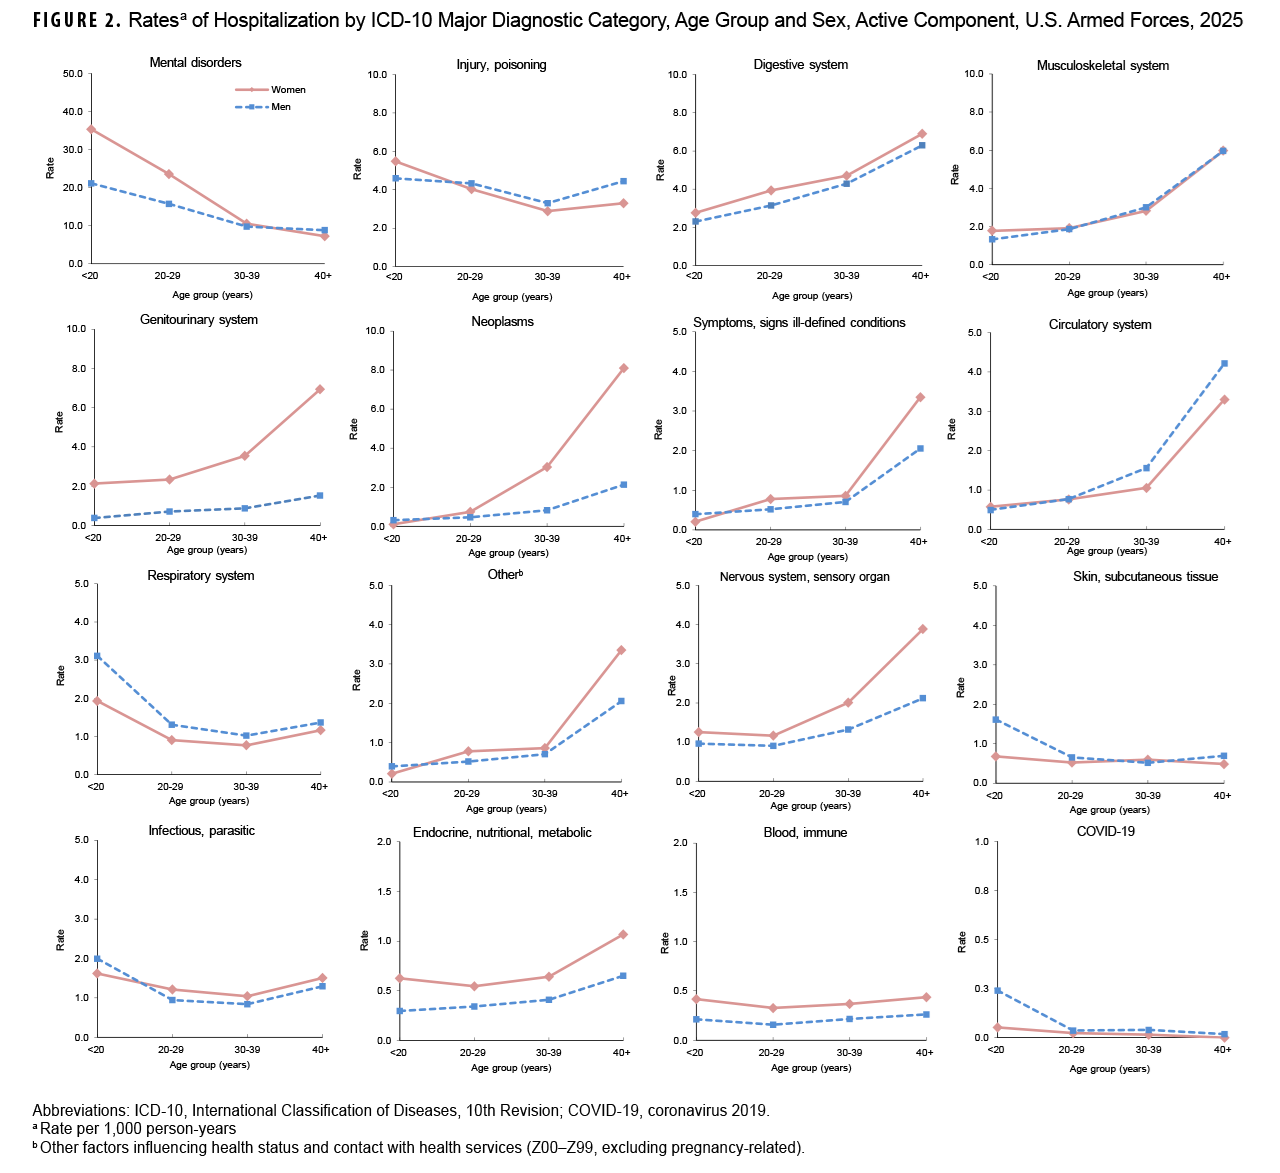
Hospitalization rates among both sexes generally increased with age for most diagnostic categories except mental health disorders, skin and subcutaneous tissue diseases, and COVID-19. Rates decreased for both sexes with increasing age for mental health disorders and were relatively stable among all age groups for infectious and parasitic disease, skin and subcutaneous tissue disease, and blood and immune disease categories.
Most frequent diagnoses
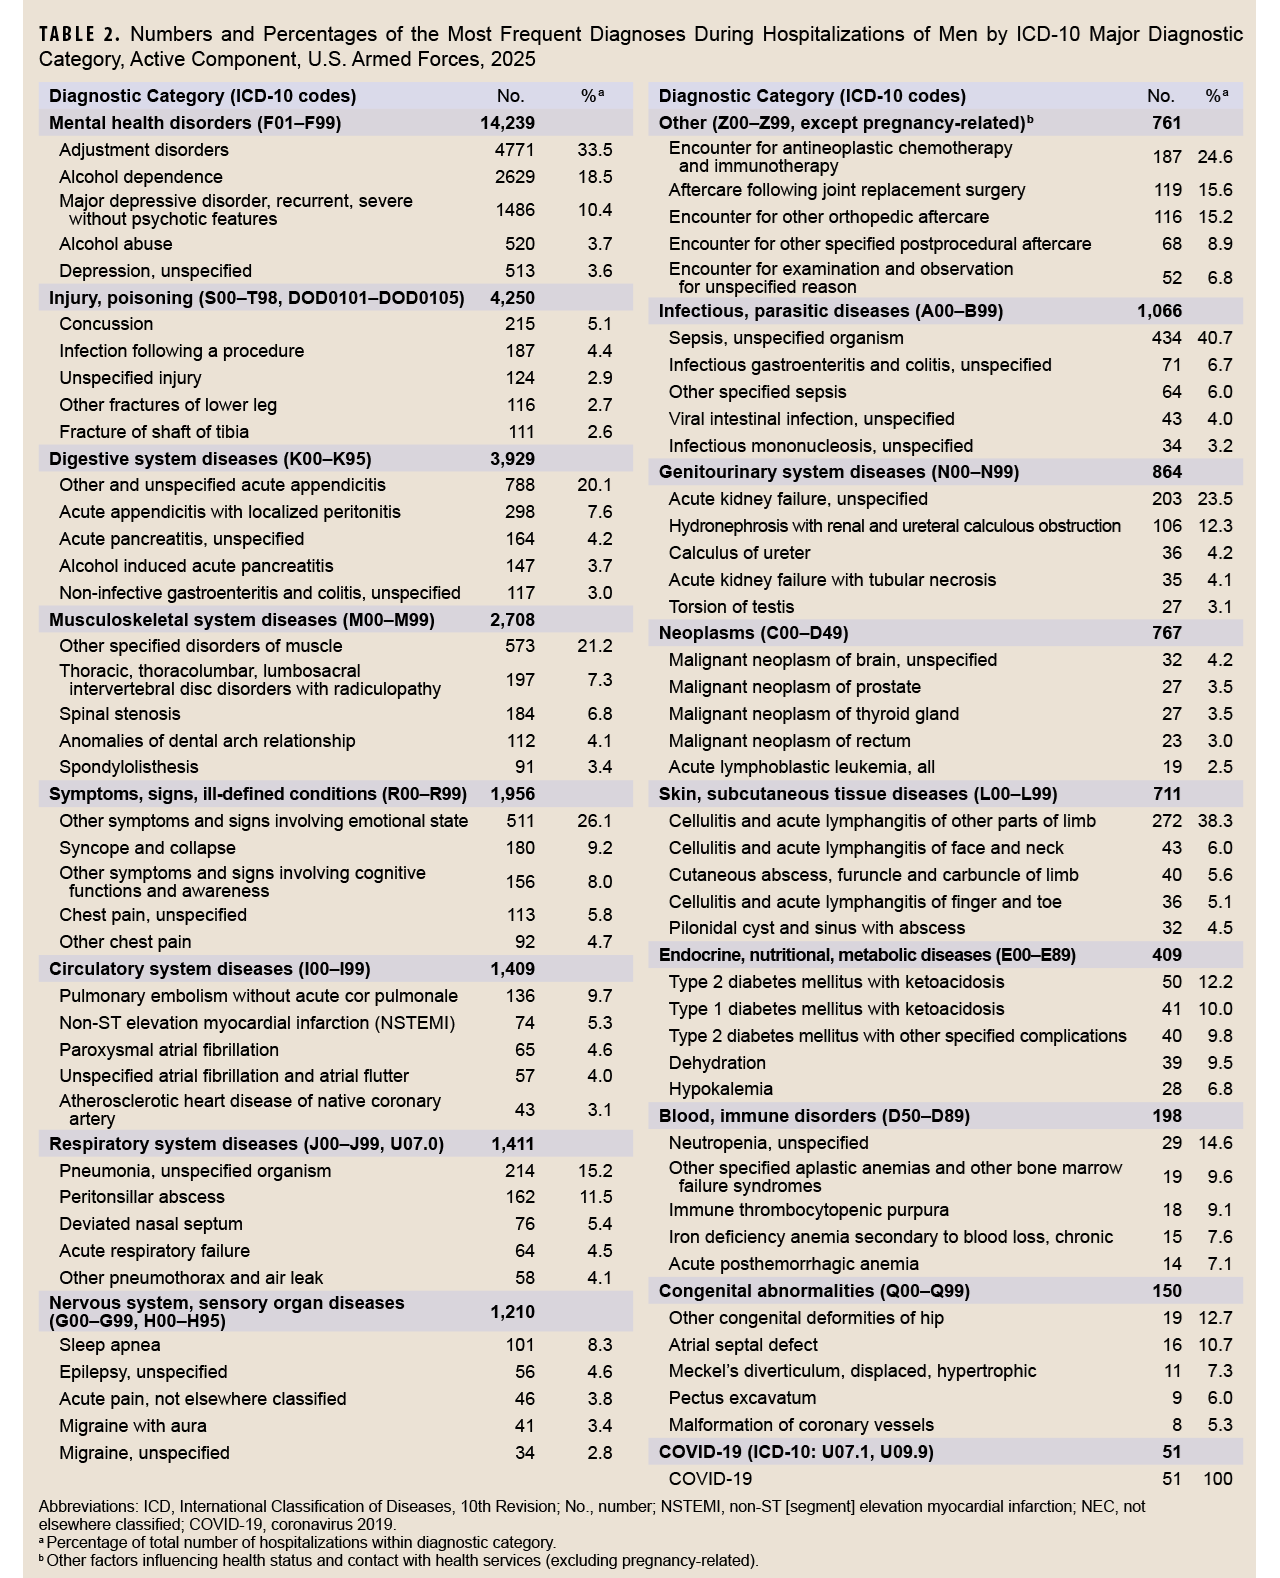
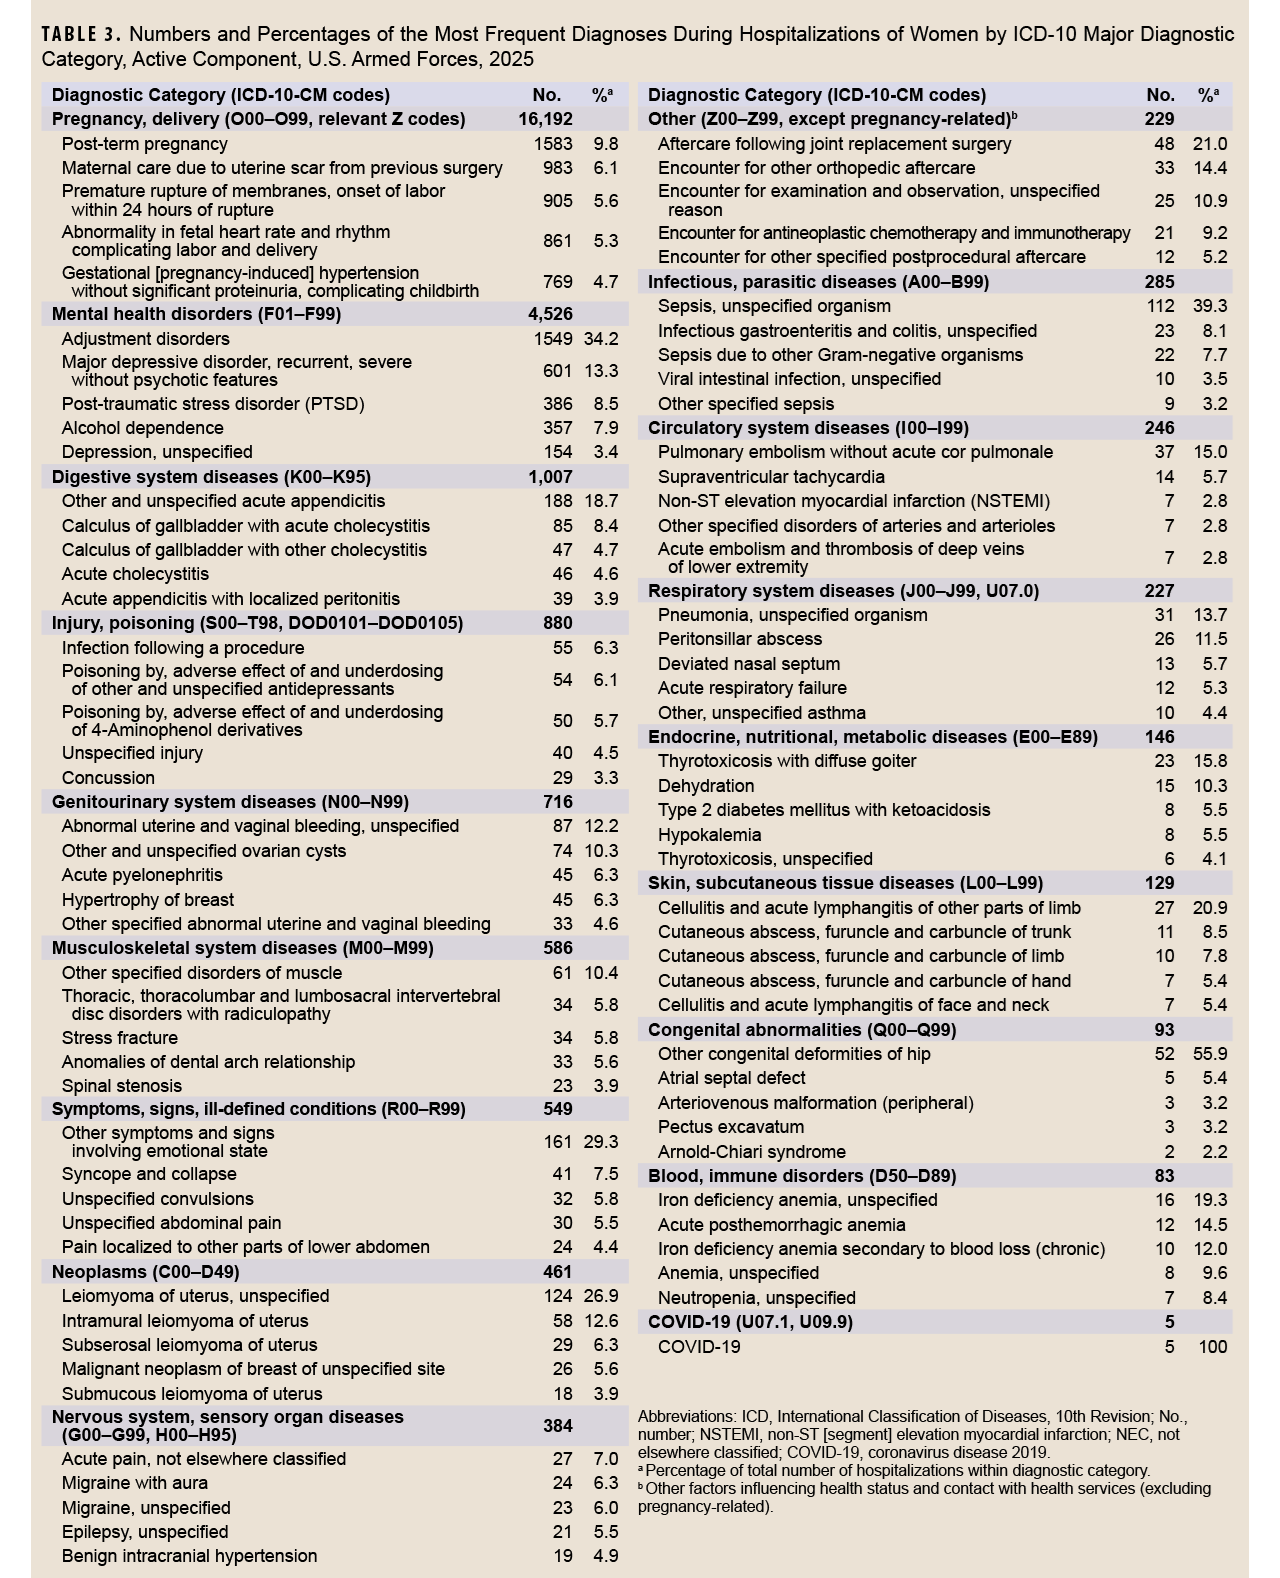
Mental health disorder diagnoses, collectively, accounted for about 40% of all hospitalizations among men and—excluding pregnancy and delivery—among women. The pregnancy and delivery category was the leading major diagnostic category for women, accounting for over three-fifths (60.5%) of all female hospitalizations (Table 3). Adjustment disorders were the leading discharge diagnosis for mental health disorders among both men (n=4,771) and women (n=1,549) (Tables 2, 3) in 2025, accounting for over 30% of total mental health disorder hospitalizations. Besides adjustment disorders, the ranking of other frequent mental health diagnoses varied by sex: For men, the next most common conditions were alcohol dependence, major depressive disorder (recurrent severe without psychotic features), alcohol abuse, and unspecified depression, while, in contrast major depressive disorder was the second most frequent condition for women, followed by post-traumatic stress disorder (PTSD), alcohol dependence, and unspecified depression.
Durations of hospitalizations
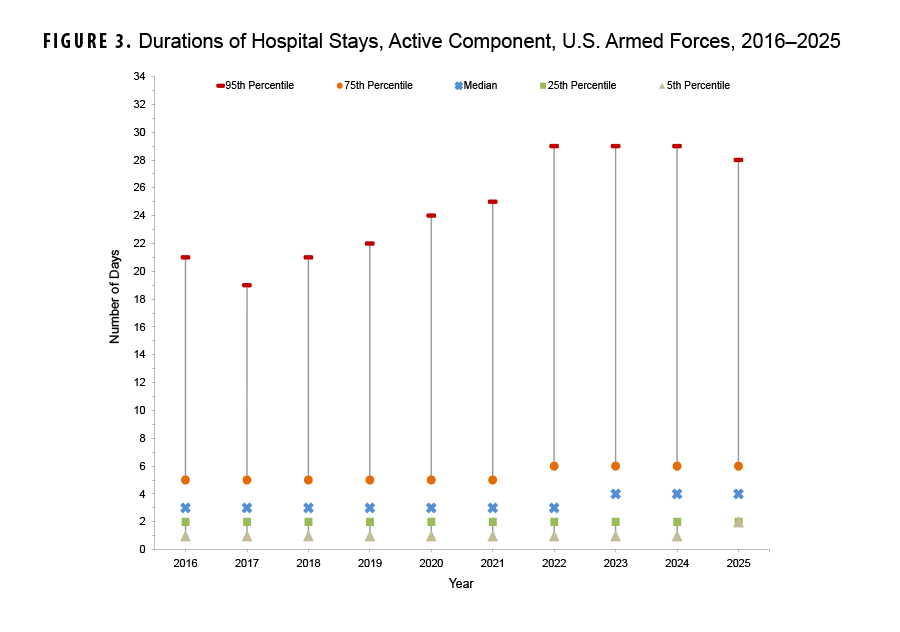 When graphically represented, hospitalization durations demonstrate a highly right-skewed (positive) distribution, with the lower limit equal to 1 day and a mode of 3 days. Because hospital stay duration is not normally distributed, the median duration with interquartile range (IQR) was chosen as the best measure of central tendency. The median (IQR) duration of hospital stays (for all causes) has remained generally stable, at 3 (2-5) days, but increased to 4 (2-6) days in 2023 and remained at that level through 2025 (Figure 3).
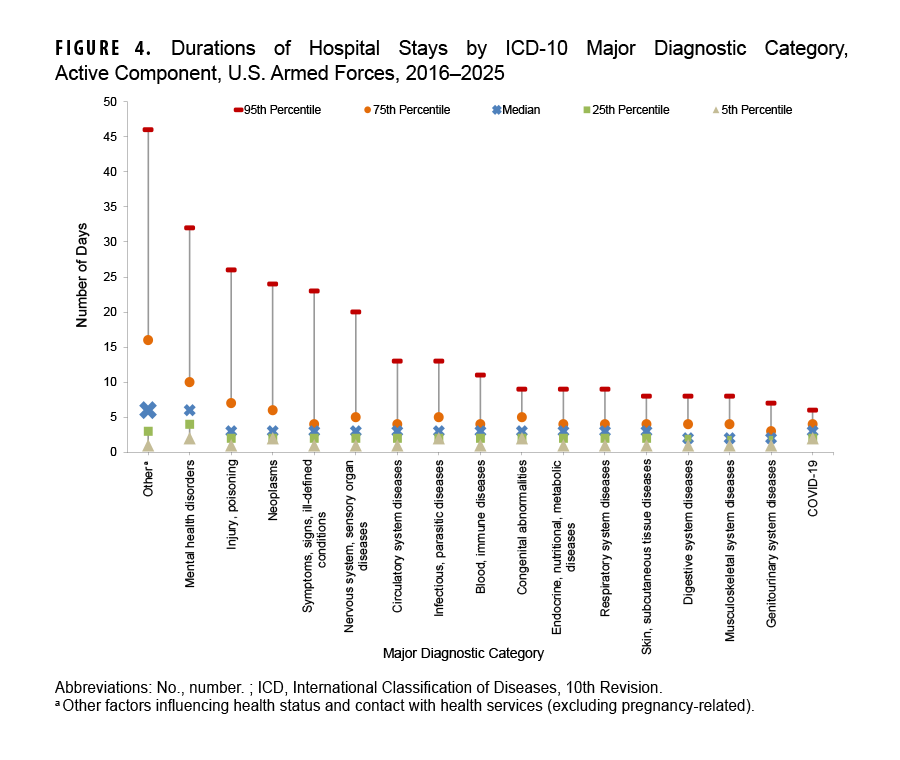
Median duration days of hospitalization varied substantially by major diagnostic category. The shortest durations of stays (median days, IQR) were observed for genitourinary system, musculoskeletal system, and digestive system hospitalizations (2 days, 2-4). The longest stays were for mental health disorders (6 days, 4-10) and ‘other’ (6 days, 3-16) hospitalizations. The remaining categories had a median of 3 (2-7) days.
Five percent of hospitalization stays exceeded 10 days for one half of ICD diagnostic categories: blood and immune disorders (11 days); infectious and parasitic diseases (13 days); circulatory system diseases (13 days); nervous system and sensory organ diseases (20 days); symptoms, signs and ill-defined conditions (23 days); neoplasms (24 days); injury and poisoning (26 days); mental health disorders (32 days); and ‘other’ (primarily orthopedic aftercare and rehabilitation following prior illness or injury accounted for a majority of these bed days; 46 days) (Figure 4).
Hospitalizations, by service
While pregnancy and delivery accounted for more hospitalizations than any other diagnostic category among active component members of the Air Force and Space Force, among ACSMs of the Army, Navy, and Marine Corps, mental health disorders were the leading cause of hospitalization (Table 4). Among all the services, the crude hospitalization rate for mental health disorders in 2025 was highest for Army ACSMs (16.3 per 1,000 p-yrs).
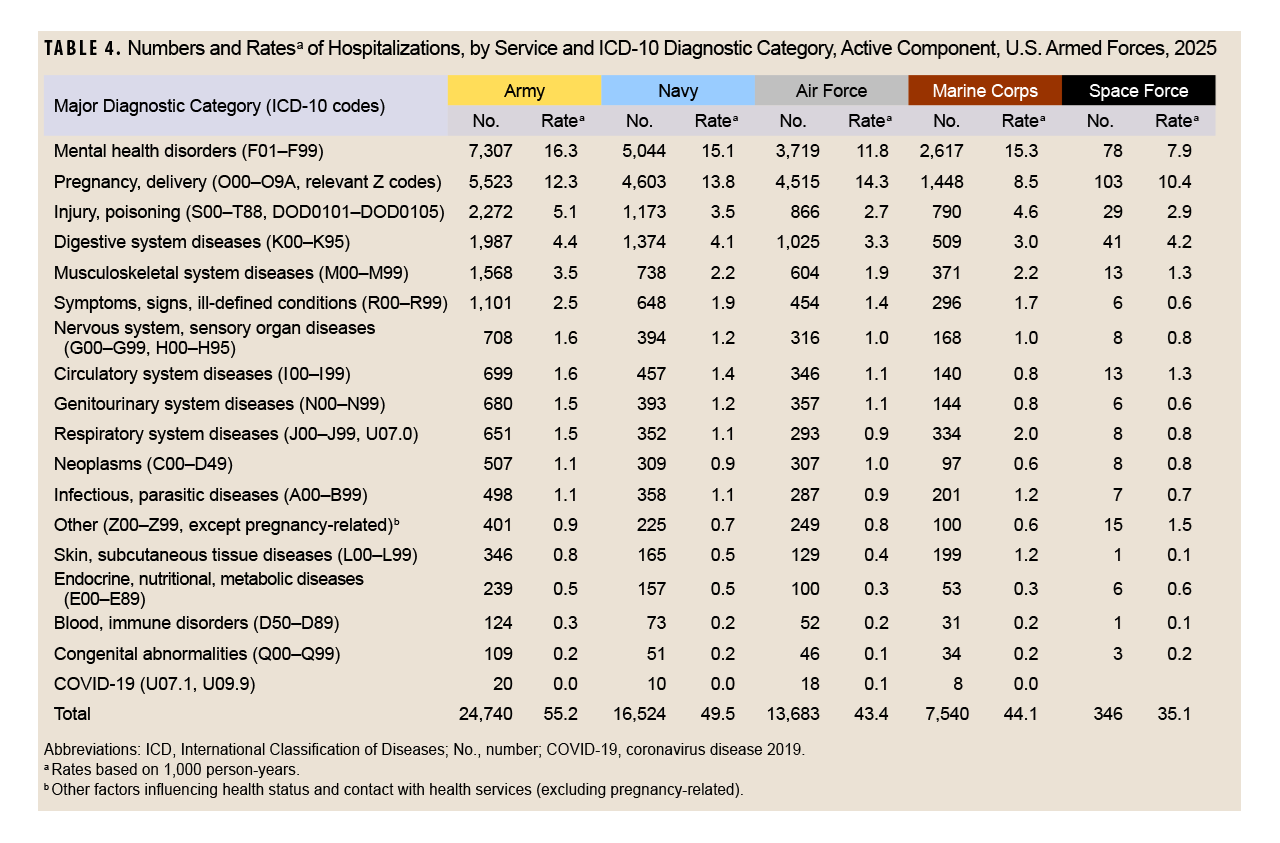
Injury was the third leading hospitalization category among Army and Marine Corps ACSMs, at 5.1 per 1,000 p-yrs and 4.6 per 1,000 p-yrs, respectively. Among Navy, Air Force, and Space Force ACSMs, the third highest rate of hospitalization was for the digestive system diseases category: 4.1, 3.3, and 4.2 per 1,000 p-yrs, respectively.
Discussion
The findings of this 2025 surveillance report document an overall decline in hospitalization rates among U.S. ACSMs over the past decade, driven largely by a 30% reduction in admissions to military facilities. Despite this general decline in overall rates, the burden of inpatient care remains heavily concentrated within a few major diagnostic categories, predominantly mental health disorders and pregnancy and delivery. While mental health-related hospitalizations experienced a modest absolute decline when compared to 2023, they continue to account for the largest proportion of admissions overall and constitute the leading cause of hospitalization for Army, Navy, and Marine Corps personnel. The prolonged durations of hospital stays associated with mental health conditions—frequently exceeding 10 days—evidences the substantial health care resources within the Military Health System required to manage conditions such as adjustment disorders, major depressive disorders, and alcohol dependence.
Significant demographic and service-specific variations also persist, most notably the markedly higher overall admission rates among service women (114.6 per 1,000 p-yrs) compared to service men (34.5 per 1,000 p-yrs). These data are consistent with national hospitalization rate trends published in 2022 for women and men ages 18-44 years (95 per 1,000 p-yrs and 37 per 1,000 p-yrs, respectively) in the general U.S. population.1 Even when excluding pregnancy and delivery, female service members required hospitalization at higher rates than their male counterparts, largely driven by mental health and genitourinary conditions. Furthermore, variations in leading causes of hospitalization among the service branches—with injury ranking high in the Army and Marine Corps, and digestive issues more prominent in the Air Force, Space Force, and Navy—highlights the diverse occupational exposures and physical demands inherent to different service environments. Continued surveillance and targeted, service-specific preventive interventions remain essential to address these vulnerabilities, optimize force readiness, and effectively allocate specialized medical resources.
Certain limitations should be considered when interpreting these results. This summary is based on primary (first-listed) discharge diagnoses only, but in many hospitalized cases multiple conditions can be present; for example, joint pain (musculoskeletal disease category) may be co-listed with an injury (injury category). In such cases, only the first-listed discharge diagnosis would be accounted in this report, which could under-estimate hospitalization rates for common conditions by bifurcating them into 2 or more sub-categories.
Since 2022, DMSS data have been housed in and analyzed from the Military Health System Information Platform (MIP). All military treatment facilities are now using GENESIS software to electronically capture medical care. Data completeness issues related to data transfers from GENESIS to the Medical Data Store (MDR) to DMSS have improved significantly. Regardless of the electronic system used to capture hospitalizations, every hospitalization record requires completion of a discharge summary before the event record is reported in the system. The data presented in this report were extracted from DMSS on April 20, 2026. Consequently, timeliness of reporting can still be an issue that may lead to underestimates of true counts and rates of hospitalizations for the most recent year of reporting. As a result, direct comparison of data reported in the current report with prior year publications should be interpreted with caution.
Reference
- National Center for Health Statistics, Centers for Disease Control and Prevention. Table: people with hospital stays in the past year, by selected characteristics—United States, selected years 1997–2019. National Hospital Care Survey. U.S. Dept. of Health and Human Services. Accessed May 26, 2026. https://www.cdc.gov/nchs/data/hus/2020-2021/hospstay.pdf