Abstract
This analysis describes the incidence of visual dysfunctions following a diagnosis of traumatic brain injury (TBI) among active component service members. The visual dysfunctions were divided into 9 major categories. A comparison group of service members with no history of TBI was used to determine relative incidence rates. The most commonly diagnosed visual dysfunctions were subjective visual disturbances, convergence insufficiency (CI), visual field loss, and accommodative dysfunction (AD). Service members with mild or moderate/severe TBI had significantly higher incidences of AD and CI compared to service members with no TBI. Results of survival analysis showed that service members with mild or moderate/severe TBI had lower probabilities of remaining without the visual dysfunction outcome at almost every week of follow-up in the first year after TBI diagnosis compared to those with no TBI. The findings of this report suggest opportunities to improve both documentation and access to care for service members with these conditions.
What Are the New Findings?
This is the first MSMR report to describe visual dysfunctions following TBI among active component service members. These dysfunctions were found across all levels of TBI severity, with similar incidence among males and females. Many categories of dysfunction had a higher likelihood of diagnosis among the moderate/severe TBI group during the first year following TBI diagnosis.
What Is the Impact on Readiness and Force Health Protection?
Visual dysfunctions following TBI diagnosis can affect functioning in many areas and may be persistent. Service members should be evaluated for visual dysfunction following diagnosis of TBI. Incidence rates of certain dysfunctions, such as AD and CI, are significantly higher after TBI and should prompt providers to evaluate for a previously undiagnosed TBI.
Background
Traumatic brain injury (TBI) is common in military service because of both deployment and non-deployment causes, including blast injuries, motor vehicle accidents, falls, and combative actions. Since 2000, there have been over 380,000 TBIs reported by the Defense and Veterans Brain Injury Center.1 While the majority of these TBIs were classified as mild, it is well known that even mild TBI can lead to challenges in multiple areas of functioning and can cause physical (e.g., headaches, sleep disturbances, and balance problems), cognitive (e.g., concentration and attention problems), and emotional (e.g., irritability, anxiety, and depression) difficulties. These effects vary depending upon the severity of the injury. Recovery times may be different for each person and situation.2
The external force that causes TBI can also cause dysfunction in the visual system. The mechanisms of a brain injury can range from overpressure from a blast wave to brain displacement (e.g., coup–contrecoup injury); trauma secondary to direct, blunt, or penetrating injury to the brain; or a combination of the above. Military personnel are at a heightened risk for such trauma because of combat and military training activities as well as potential exposure to powerful blast explosions. TBI effects can negatively affect the ability to receive, process, and react to visual stimuli. Visual dysfunction is one of the most common concerns reported after TBI and includes a wide range of symptoms. These symptoms can include blurred and/or double vision, difficulties reading, light sensitivity (photophobia), and decreased peripheral vision.3 Symptoms are often the result of oculomotor dysfunctions, such as accommodative dysfunction (AD), convergence insufficiency (CI), and also visual field loss (VFL), which have been reported at higher prevalence rates for patients with TBI.4 AD is a group of disorders affecting the ability to adjust focus from distance to near tasks, such as reading. It can include difficulties with the initiation, magnitude, and sustainment of near focus effort.5 CI is a condition where the eyes cannot be brought together in unison on a near target, often leading to visual suppression of 1 eye and/or double vision when performing near visual tasks. AD and CI can be present concurrently in the same patient, with variable contributions to overall symptoms of blurred vision, difficulty reading, irritability, intermittent diplopia, poor concentration, and headaches associated with near work.6,7 Individuals can continue to experience these symptoms of visual dysfunction for years after recovery from other TBI symptoms.8
Because of the importance of vision to human activity, dysfunctions of the visual system associated with TBI can interfere with the overall rehabilitation and reintegration of the individual. Even with the increasing body of knowledge concerning these dysfunctions, screening for such conditions is not consistent, considering that as many as 79% of TBI patients report subjective visual complaints.9 Moreover, a recent study estimated significant costs associated with TBI-related visual dysfunction.10
The objective of this report is to characterize the magnitudes and trends of multiple categories of visual dysfunctions among active component service members diagnosed with TBI as well as the development of these dysfunctions after the initial TBI diagnosis. This information will provide valuable input into screening recommendations for visual dysfunction after TBI. Additionally, these baseline data will inform ongoing evaluation of interventions for visual dysfunction after TBI.
Methods
Data were obtained from the Defense Medical Surveillance System (DMSS), a longitudinal administrative data warehouse that contains electronic medical records of hospitalization and ambulatory medical encounters in military medical treatment facilities, civilian facilities (if care was reimbursed through the Military Health System), and in the deployed setting if documented in the Theater Medical Data Store. Data are limited to recorded diagnostic codes and demographic variables. No clinical data are available for further validation of the chosen case definitions.
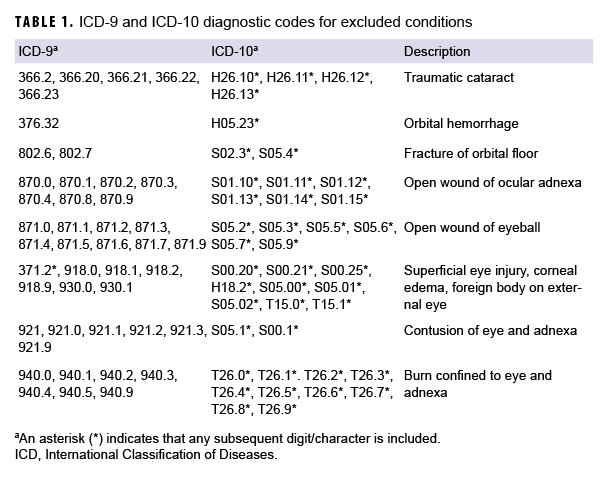
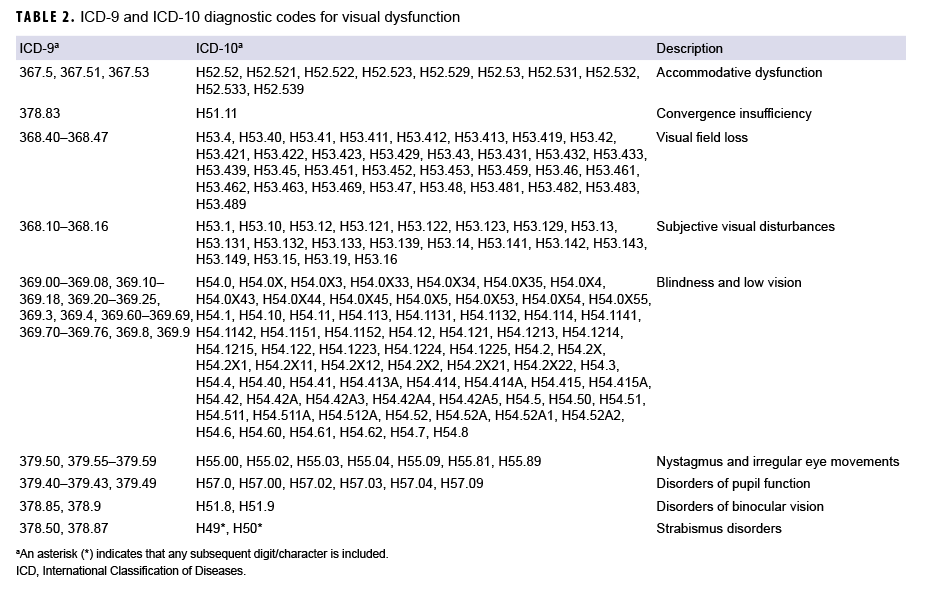
Incident cases of TBI diagnosed between 2006 and 2017 among active component service members in the Army, Navy, Air Force, or Marine Corps were identified from DMSS records using the standard Armed Forces Health Surveillance Branch case definition.11 The case definition required at least 1 inpatient, outpatient, or in-theater medical encounter with a diagnosis of TBI in any diagnostic position.11 Severity of TBI was classified as mild or moderate/severe using International Classification of Diseases (ICD), 9th and 10th Revision, diagnostic codes.11 An individual could be counted as a case of TBI only once per lifetime, and the earliest qualifying medical encounter was considered the incidence date. TBI cases were excluded if they had a diagnosis for any type of ocular trauma at any time during their military service that was recorded in any diagnostic position of an inpatient, outpatient, or in-theater medical encounter (Table 1). In addition, TBI cases were excluded if they had a diagnosis for any visual dysfunction that was recorded in any diagnostic position of an inpatient, outpatient, or in-theater medical encounter before the TBI incidence date (Table 2). The categories of visual dysfunction were based on the results of a meta-analysis of several visual dysfunctions.4
Each TBI case was matched to another active component service member (control) who was in service at the time of the case's TBI diagnosis and who had never been diagnosed with TBI or ocular trauma during their military service. Individuals were matched on age (within +/- 1 year) and sex. The TBI incidence date was considered the reference date for each matched pair. Controls were excluded if they had a diagnosis for any visual dysfunction in any diagnostic position of an inpatient, outpatient, or in-theater medical encounter before the reference date. Cases and controls were followed up to 1 year after the reference date to determine incidence of visual dysfunction. Follow-up time was censored at the time of incident visual dysfunction diagnosis, when a service member left active component military service, or at the end of 1 year, whichever came first. In addition, individuals were followed up separately for each type of visual dysfunction. For example, time at risk for AD was censored at the time of incident AD diagnosis; however, time at risk would continue to accrue for other outcomes such as CI. As such, individuals could be counted multiple times for different outcomes.
To qualify as a case of visual dysfunction, an individual was required to have at least 2 inpatient, outpatient, or in-theater medical encounters within 1 year. The diagnosis could be documented in any diagnostic position and had to be for the same visual dysfunction type in both encounters. The relative risk for each visual dysfunction was calculated by comparing the incidence of visual dysfunction among those with no history of TBI to the incidence among those with incident mild or moderate/severe TBI. Multivariable Poisson regression models were used to calculate adjusted incidence rate ratios for the TBI cohorts, controlling for age, sex, race/ethnicity group, service branch, rank, military occupation, and history of deployment before the reference date. Because of the large sample size, p values less than .01 were considered statistically significant. As a secondary analysis, the time to first visual dysfunction encounter was plotted for each of the TBI cohorts.
Results
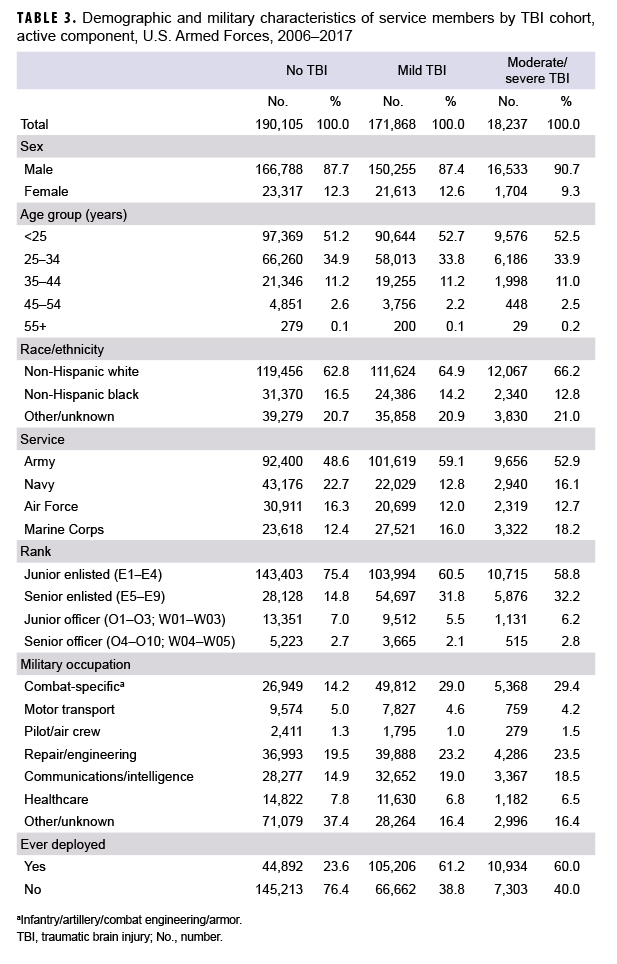
A search of DMSS records between 2006 and 2017 identified 171,868 cases of mild TBI and 18,237 cases of moderate/severe TBI. These cases were matched to 190,105 controls (Table 3). Of note, there was 1 female TBI case born in the 1940s who could not be matched to a control and was subsequently dropped from the analysis. Most incident TBI cases occurred among men, non-Hispanic whites, Army members, those less than 25 years of age, junior enlisted service members, and those who had ever deployed (Table 3).
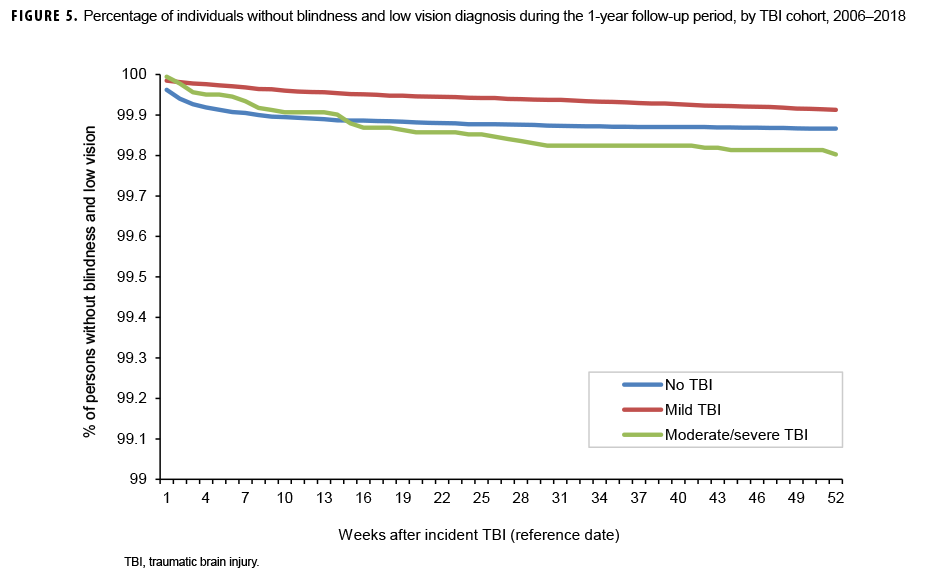
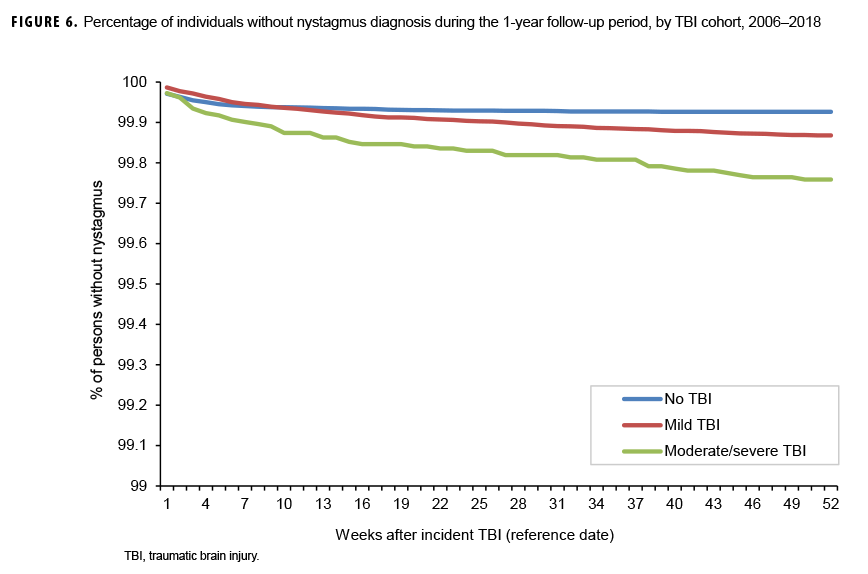
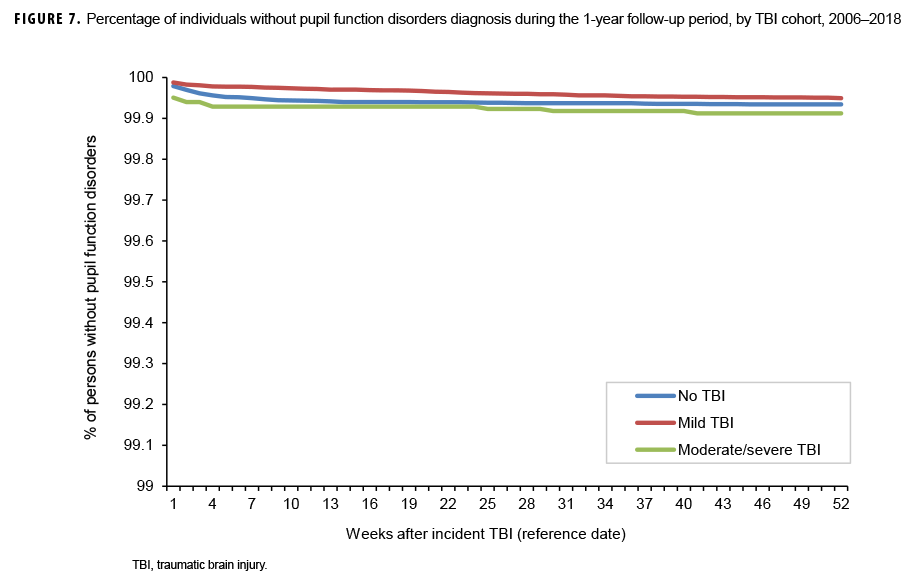
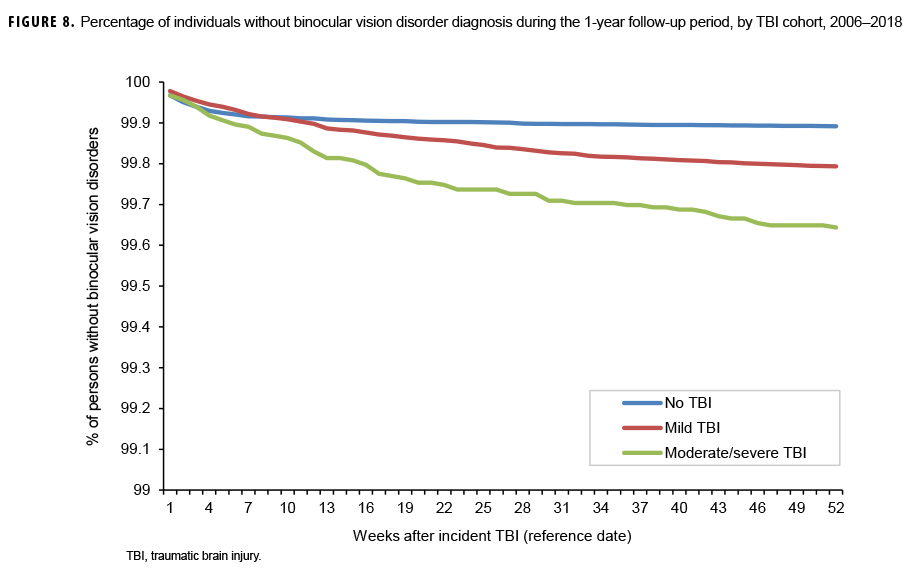
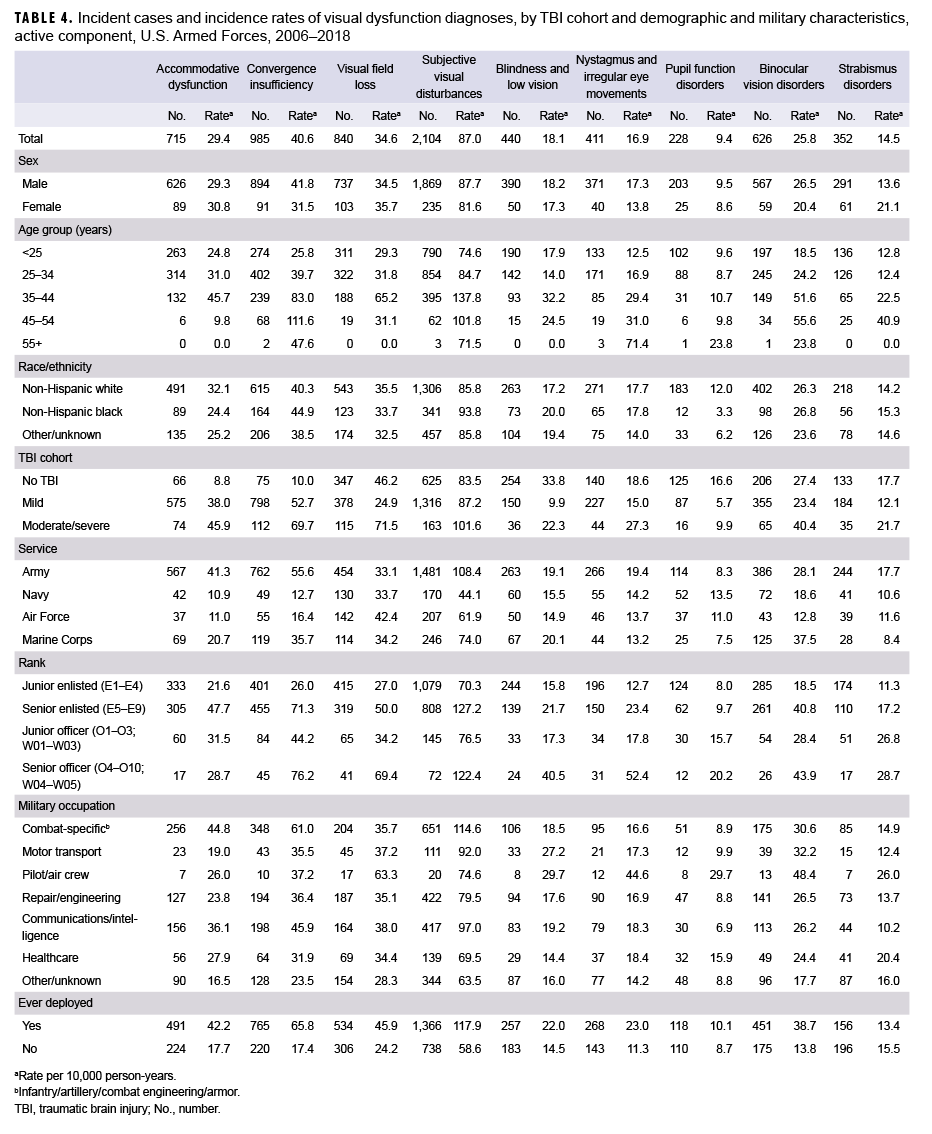
The most commonly diagnosed visual dysfunction was subjective visual disturbances (n=2,104; 87.0 per 10,000 person-years [p-yrs]), followed by CI, VFL, AD, binocular vision disorders, blindness and low vision, nystagmus, strabismus disorders, and disorders of pupil function (n=228; 9.4 per 10,000 p-yrs) (Table 4). For AD and CI, overall incidence rates were highest among the moderate/severe TBI cohort and lowest in the no TBI cohort. For subjective visual disturbances, nystagmus, binocular vision disorders, and strabismus disorders, incidences were highest in the moderate/severe TBI cohort and similar among those in the mild TBI and no TBI cohorts. Overall rates of VFL were highest in the moderate/severe TBI cohort and lowest in the mild TBI cohort. However, for blindness and low vision and disorders of pupil function, incidences were highest in the no TBI cohort and lowest in the mild TBI cohort.
Among the 3 cohorts (mild TBI, moderate/severe TBI, and no TBI), overall incidence rates of visual dysfunction were higher in males compared to females for CI, nystagmus, and binocular vision disorders. Rates of other visual dysfunctions were similar among males and females except for strabismus disorders, for which the rate was higher in females compared to males. Overall incidence rates of AD, VFL, and pupil function disorders were higher among non-Hispanic white service members compared to those in other race/ethnicity groups; however, rates of CI and subjective visual disturbances were higher in non-Hispanic black service members. The overall incidence rates of other visual dysfunctions were similarly distributed among the race/ethnic groups. Generally, for all types of visual dysfunctions, incidence increased with increasing age.
Overall incidence rates of AD, CI, subjective visual disturbances, nystagmus, and strabismus disorders were higher among service members in the Army compared to those in other service branches. Rates of binocular vision disorders and blindness and low vision were highest among Air Force members, rates of pupil function disorders were higher among those in the Navy, and rates of blindness and low vision were highest among those in the Marine Corps and Army. In general, incidence rates of visual dysfunctions were higher among the senior officer and enlisted ranks compared to the junior officer and enlisted ranks. Overall rates of AD, CI, and subjective visual disturbances were highest among service members in combat-specific occupations. In contrast, rates of all other visual dysfunctions were highest among those in pilot/air crew occupations. Except for strabismus disorders, overall incidence rates of visual dysfunctions were higher among those who had previously deployed compared to those who had not. Rates of strabismus disorders were similar among those with and without previous deployment.
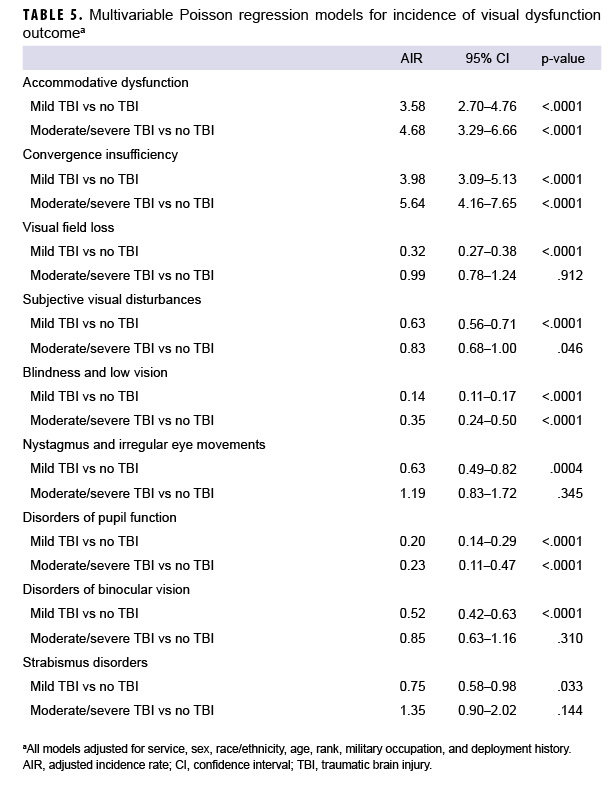
After adjusting for age, sex, service branch, rank, military occupation, and history of deployment, service members with mild or moderate/severe TBI had significantly higher overall rates of AD (adjusted incidence rate [AIR]=3.58 and AIR=4.68, respectively) and CI (AIR=3.98 and AIR=5.64, respectively) compared to service members with no TBI (Table 5). The AIRs of VFL, subjective visual disturbances, nystagmus, and binocular vision disorders were significantly lower among service members with mild TBI compared to those with no TBI; however, there were no significant differences in the AIRs of each of these visual dysfunctions among those with moderate/severe TBI compared to those with no TBI. The AIRs for blindness and low vision and disorders of pupil function were significantly lower in both the mild and moderate/severe TBI cohorts compared to the no TBI cohort. There were no statistically significant differences in the AIR of strabismus disorders among the TBI cohorts.
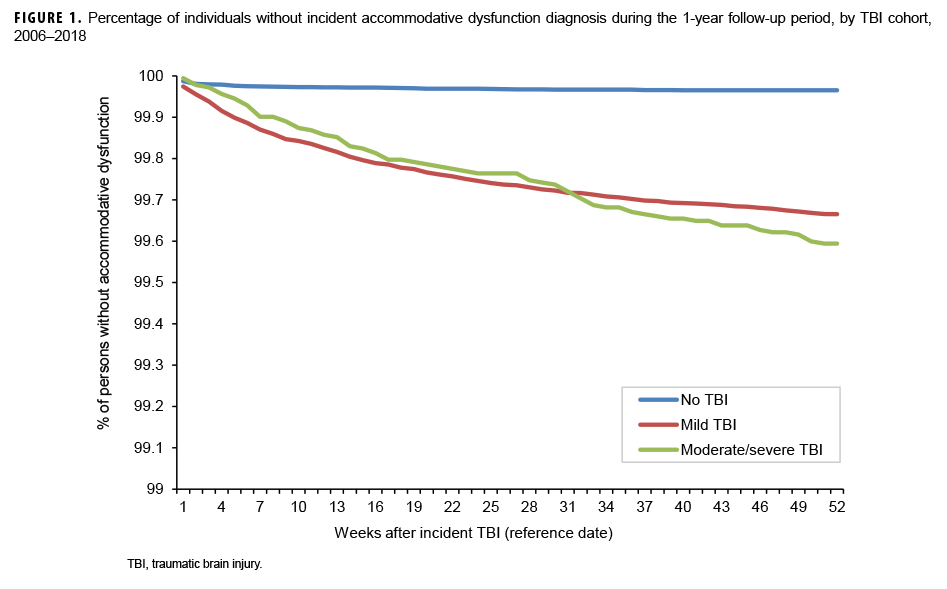
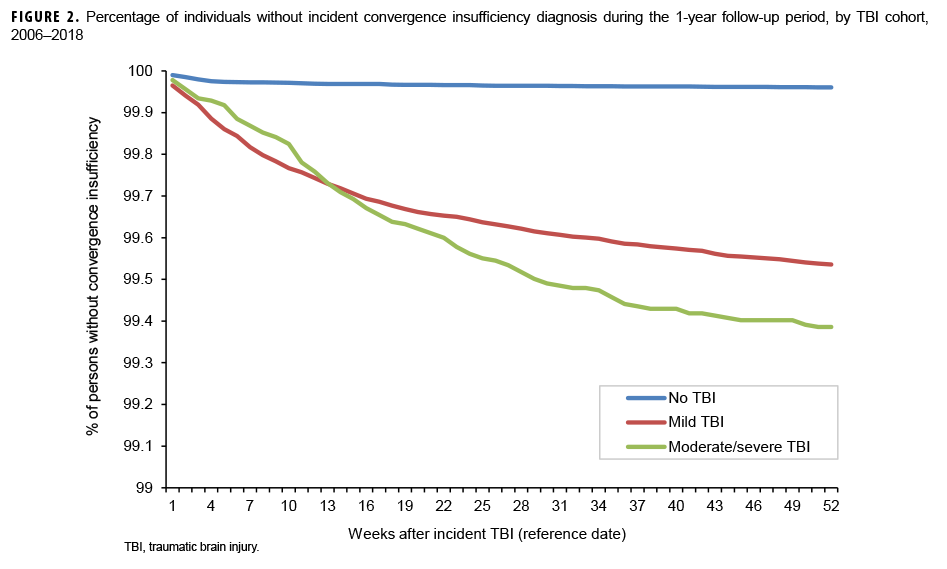
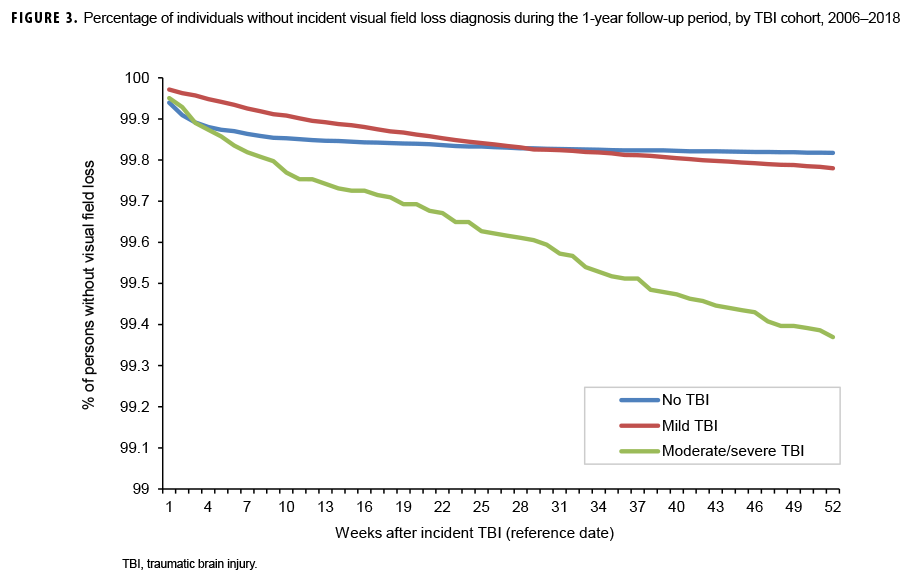
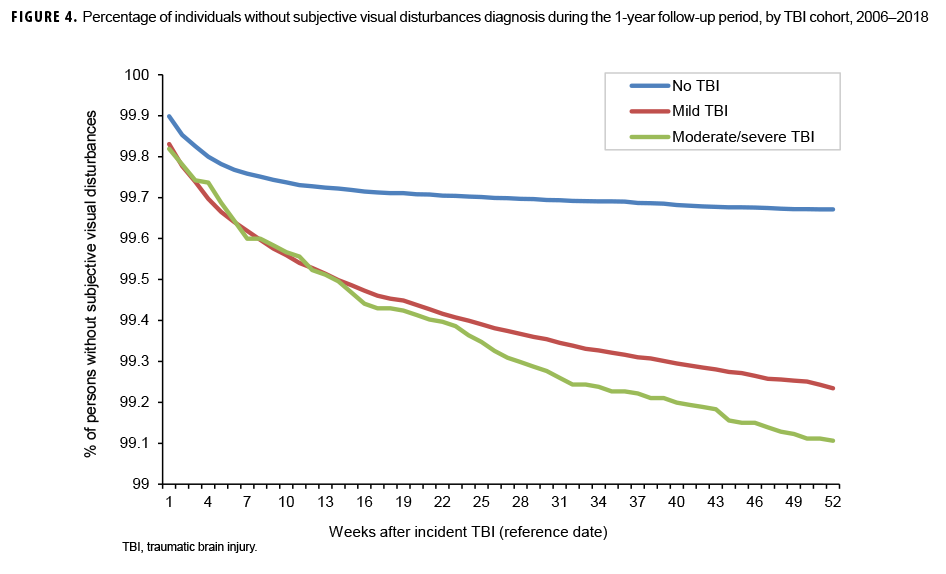
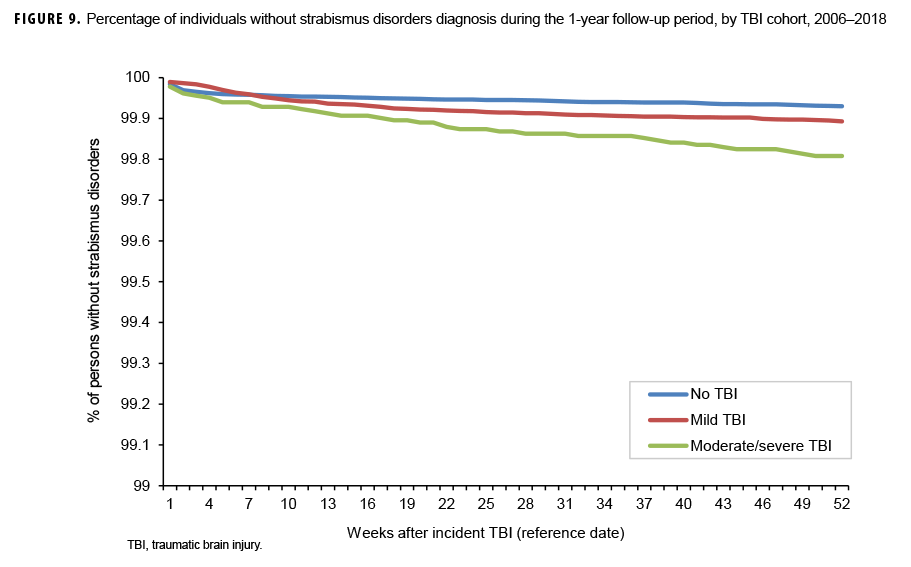
The survival curves (secondary analysis) show the proportion of individuals without incident diagnoses of visual dysfunction by week. These curves varied by TBI cohort and by visual dysfunction outcome (Figures 1–9). For AD, CI, and subjective visual disturbances, service members with mild or moderate/severe TBI were more likely to receive the visual dysfunction diagnosis at almost every week of follow-up compared to those in the no TBI cohort (Figures 1, 2, 4). For VFL, nystagmus, binocular vision dysfunction, and strabismus disorders, service members in the moderate/severe TBI cohort were more likely to receive the visual dysfunction diagnosis during almost every week of follow-up compared to those in the mild and no TBI cohorts; however, those with mild TBI were less likely to be diagnosed with the visual dysfunction during the earlier weeks of follow-up compared to those with no TBI (Figures 3, 6, 8, 9). For blindness and low vision, the moderate/severe TBI cohort had consistently higher percentages of blindness and low vision diagnoses compared to the other 2 cohorts during weeks 15–52 (Figure 5). For pupil dysfunction, the proportions of individuals without incident diagnoses were consistent during the entire 1-year follow-up period (Figure 7). In the later weeks of follow-up, the mild TBI patients became more likely to be diagnosed with VFL, nystagmus, binocular vision problems, and strabismus disorders than the no TBI group. Finally, higher percentages of the mild TBI cohort remained without blindness and low vision or disorders of pupil function at each week of follow-up compared to the other 2 cohorts (Figures 5, 7).
Editorial Comment
This report demonstrated that service members with mild or moderate/severe TBI have significantly higher AIRs of AD and CI compared to service members with no TBI. AIRs of these conditions were highest among those with moderate/severe TBI.4 This finding is consistent with a recently published meta-analysis on the prevalence of several visual dysfunctions after TBI. The meta-analysis reviewed 22 published studies through July 2018 on AD, CI, VFL, and visual acuity loss. This analysis found a high prevalence of AD and CI among mild TBI patients (43.2% and 37.2%, respectively).4 These prevalence rates were also significantly higher than those reported in the literature for no TBI control populations. In this report, AIRs of AD and CI were highest among those with moderate/severe TBI.
Results of the survival analysis showed that AD or CI may be diagnosed soon after the initial TBI diagnosis. Later diagnosis of these visual dysfunctions was observed among the moderate/severe TBI group. For AD, among mild TBI patients, approximately half of the cases were diagnosed by 12 weeks and three-quarters were diagnosed by 25 weeks after TBI diagnosis. Among moderate/severe TBI patients, half of the cases were not diagnosed until 18 weeks after TBI diagnosis and three-quarters were not diagnosed until 33 weeks. For CI among mild TBI patients, approximately half were diagnosed by 10 weeks and three-quarters by 23 weeks. Among moderate/severe TBI patients, half of the cases of CI were not diagnosed until 15 weeks after TBI diagnosis and three-quarters were not diagnosed by approximately 27 weeks. It is unclear at present if a delay in recognition and subsequent treatment of these conditions affects recovery, but CI has been shown to assist in identifying athletes at risk for prolonged recovery after a sport-related concussion and thus may be a prognostic screening method after TBI.12
This study is subject to certain important limitations. The categories of visual dysfunctions used were inclusive, allowing for broad capture in this initial surveillance report. All encounters were utilized in analysis rather than limiting to encounters by specific provider type. Additionally, no standard coding guidance is available for visual function following TBI, which would provide higher confidence in a surveillance definition. Because the analysis used administrative data, questions that would require detailed review of clinical records for optimal mapping of signs and symptoms were unable to be addressed. This is particularly important for conditions that would likely be asymptomatic and require specific diagnostic abilities (such as pupil function abnormalities, eye movement disorders, and nystagmus).
This study utilized a 1-year follow-up period after the documentation of the incident TBI diagnosis to ensure a greater likelihood that the diagnosed visual dysfunction was attributable to the TBI event. It is possible that there was a lag in diagnosis between the TBI event and documentation of a diagnosis of the TBI. Visual dysfunctions that occurred during this lag period would not be captured and attributed to the original TBI, potentially decreasing the counts of visual dysfunctions. Previous studies have reported no difference in multiple types of visual symptoms in terms of time after TBI event.13 It is possible that visual dysfunction developed because of some other illness or injury; however, individuals with previously diagnosed ocular trauma were excluded from the current analysis. In addition, there could be a lag between the time of the TBI event and the time the diagnosis was actually recorded in the individual's medical record. The apparently later documentation of visual dysfunctions reflected by the survival curves for the moderate/severe TBI cohort for these conditions is unlikely to be a result of later onset of these conditions. Visual dysfunctions are known to manifest soon after injury, and the time difference observed in the current study may be related to detection bias in which the visual assessment of more severe TBI cases is delayed in favor of higher-priority medical care for the TBI itself and/or other associated injuries. Confounding due to factors that could not to be adjusted for in the analysis is another potential limitation. For example, if "sicker" service members are more likely to develop blindness and low vision and less likely to be diagnosed with TBI (perhaps because of being less physically active and therefore having less exposure opportunity), a negative bias in the association between TBI and blindness and low vision would exist. The more general categories of visual dysfunction (such as subjective visual disturbance) have multiple etiologies unrelated to TBI and would be expected to be recorded at high rates in the non-TBI population. Finally, the fact that criteria for the diagnosis of AD and CI are not standardized across providers could result in misclassification of these visual dysfunction outcomes. If service members diagnosed with TBI are more likely to be screened for visual dysfunction, a differential misclassification bias that would overestimate the rate ratios for the associations between TBI and visual dysfunction outcomes could result.
Consistent and timely diagnosis of these conditions will allow for early intervention. Current therapies include the use of specialized optical correction, including glasses with prisms (to address CI), oculomotor therapy to increase the efficiency of eye movements, and combination approaches using both correction and therapy.14
The findings of the current study suggest several initial recommendations for improving recognition and diagnosis of these visual dysfunctions. Providing primary care providers with standardized screening instruments and referral guidelines for visual dysfunctions after TBI would increase evaluations by eye care providers. Since visual acuity is not usually affected in mild TBI patients,11 standard tests for visual acuity cannot be considered sufficient for the measure of visual health after TBI. In light of the increased risk of AD and CI among TBI patients of all severity, eye care providers diagnosing these conditions should seek a history of TBI that may not have been documented. This practice would identify additional service members who could benefit from comprehensive TBI evaluation and rehabilitation. Finally, the development and dissemination of standard documentation and coding guidelines for visual dysfunction following TBI would be expected to improve surveillance and monitoring efforts for these important conditions and possibly improve continuity of care for affected service members.
Author affiliations: Department of Defense/Veterans Affairs Vision Center of Excellence, Defense Health Agency Research and Development Directorate (COL Reynolds, Dr. Barker, Dr. Merezhinskaya); Department of Veterans Affairs (Dr. Barker, Dr. Merezhinskaya); Armed Forces Health Surveillance Branch, Defense Health Agency (Mr. Oh, Dr. Stahlman)
Disclaimer: The contents, views, or opinions expressed in this publication are those of the author(s) and do not necessarily reflect the official policy or position of the Defense Health Agency, Department of Defense, or the U.S. Government.
References
- Defense and Veterans Brain Injury Center. DOD worldwide numbers for TBI. https://dvbic.dcoe.mil/dod-worldwide-numbers-tbi. Accessed 4 June 2019.
- Defense and Veterans Brain Injury Center. TBI basics. https://dvbic.dcoe.mil/article/tbi-basics. Accessed 14 May 2019.
- Armstrong RA. Visual problems associated with traumatic brain injury. Clin Exp Optom. 2018;101(6):716–726.
- Merezhinskaya N, Mallia RK, Park DW, Bryden DW, Mathur K, Barker FM. Visual deficits and dysfunctions associated with traumatic brain injury: A systematic review and meta-analysis. Optom Vis Sci. 2019;96(8):542–555.
- Duke-Elder S. The Practice of Refraction. 5th ed. St. Louis, MO: C.V. Mosby Company; 1949:141–151.
- Cooper JS, Burns CR, Cotter SA, Daum KM, Griffin JR, Scheiman MM. Optometric Clinical Practice: Guideline Care of the Patient with Accommodative and Vergence Dysfunction. St. Louis, MO: American Optometric Association; 2011.
- Singman EL, Matta NS, Silbert DI. Convergence insufficiency associated with migraine: a case series. Am Orthopt J. 2014;64:112–116.
- Magone MT, Kwon E, Shin SY. Chronic visual dysfunction after blast-induced mild traumatic brain injury. J Rehabil Res Dev. 2014;51(1):71–80.
- Lew HL, Poole JH, Vanderploeg RD, et al. Program development and defining characteristics of returning military in a VA Polytrauma Network Site. J Rehabil Res Dev 2007;44(7):1027–1034.
- Frick KD, Singman EL. Cost of military eye injury and vision impairment related to traumatic brain injury: 2001–2017. Mil Med. 2019;184(5–6):338–343.
- Defense Health Agency. Armed Forces Health Surveillance Branch. Surveillance Case Definition. Traumatic Brain Injury. https://health.mil/Reference-Center/Publications/2015/12/01/Traumatic-Brain-Injury. Published Jan. 2019. Accessed 4 June 2019.
- DuPrey KM, Webner D, Lyons A, Kucuk CH, Ellis JT, Cronholm PF. Convergence insufficiency identifies athletes at risk of prolonged recovery from sport-related concussion. Am J Sports Med. 2017;45(10):2388–2392.
- Capo-Aponte JE, Jorgensen-Wagers KL, Sosa JA, et al. Visual dysfunctions at different stages after blast and non-blast mild traumatic brain injury. Optom Vis Sci. 2017;94(1):7–15.
- Simpson-Jones ME, Hunt AW. Vision rehabilitation interventions following mild traumatic brain injury: a scoping review. Disabil Rehabil. 2019;41(18):2206–2222.